GE 2013 Annual Report Download - page 53
Download and view the complete annual report
Please find page 53 of the 2013 GE annual report below. You can navigate through the pages in the report by either clicking on the pages listed below, or by using the keyword search tool below to find specific information within the annual report.-
 1
1 -
2
-
3
-
4
-
5
-
6
-
7
-
8
-
9
-
10
-
11
-
12
-
13
-
14
-
15
-
16
-
17
-
18
-
19
-
20
-
21
-
22
-
23
-
24
-
25
-
26
-
27
-
28
-
29
-
30
-
31
-
32
-
33
-
34
-
35
-
36
-
37
-
38
-
39
-
40
-
41
-
42
-
 43
43 -
 44
44 -
 45
45 -
 46
46 -
 47
47 -
 48
48 -
 49
49 -
 50
50 -
 51
51 -
 52
52 -
 53
53 -
 54
54 -
 55
55 -
 56
56 -
 57
57 -
 58
58 -
 59
59 -
 60
60 -
 61
61 -
 62
62 -
 63
63 -
64
-
65
-
66
-
67
-
68
-
69
-
70
-
71
-
72
-
73
-
74
-
75
-
76
-
77
-
78
-
79
-
80
-
81
-
82
-
83
-
84
-
85
-
86
-
87
-
88
-
89
-
90
-
91
-
92
-
93
-
94
-
95
-
96
-
97
-
98
-
99
-
100
-
101
-
102
-
103
-
104
-
105
-
106
-
107
-
108
-
109
-
110
-
111
-
112
-
113
-
114
-
115
-
116
-
117
-
118
-
119
-
120
-
121
-
122
-
123
-
124
-
125
-
126
-
127
-
128
-
129
-
130
-
131
-
132
-
133
-
134
-
135
-
136
-
137
-
138
-
139
-
140
-
141
-
142
-
143
-
144
-
145
-
146
-
147
-
148
-
149
-
150
 |
 |

’
GE 2013 ANNUAL REPORT 51
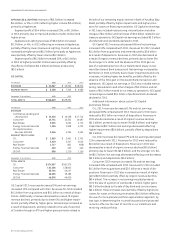
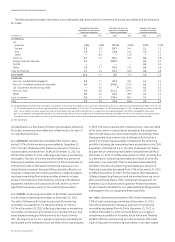
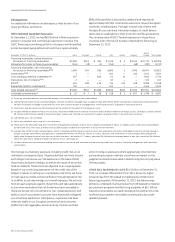
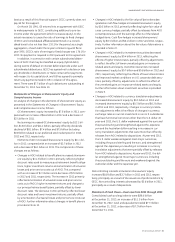
Financing receivables Nonearning receivables Allowance for losses
December 31 (In millions) 2013 2012 2013 2012 2013 2012
COMMERCIAL
CLL
Americas $ 68,585 $ 72,517 $ 1,243 $ 1,333 $ 473 $ 490
Europe
(a) 37,962 37,037 1,046 1,299 415 445
Asia 9,469 11,401 413 193 90 80
Other
(a) 451 603 — 52 — 6
Total CLL 116,467 121,558 2,702 2,877 978 1,021
Energy Financial Services 3,107 4,851 4 — 8 9
GECAS 9,377 10,915 — — 17 8
Other 318 486 6 13 2 3
Total Commercial 129,269 137,810 2,712 2,890 1,005 1,041
REAL ESTATE 19,899 20,946 2,301 444 192 320
CONSUMER
Non-U.S. residential mortgages (b) 30,501 33,350 1,766 2,567 358 480
Non-U.S. installment and revolving credit 13,677 17,816 88 213 594 582
U.S. installment and revolving credit 55,854 50,853 2 1,026 2,823 2,282
Non-U.S. auto 2,054 4,260 18 24 56 67
Other 6,953 8,070 345 351 150 172
Total Consumer 109,039 114,349 2,219 4,181 3,981 3,583
Total $ 258,207 $ 273,105 $ 7,232 $ 7,515 $ 5,178 $ 4,944
(a) During 2013, we transferred our European equipment services portfolio from CLL Other to CLL Europe. Prior-period amounts were reclassified to conform to the current
period presentation.
(b) Included financing receivables of $12,025 million and $12,221 million, nonearning receivables of $751 million and $1,036 million and allowance for losses of $139 million and
$142 million at December 31, 2013 and 2012, respectively, primarily related to loans, net of credit insurance, whose terms permitted interest-only payments and high
loan-to-value ratios at inception (greater than 90%). At origination, we underwrite loans with an adjustable rate to the reset value. Of these loans, about 85% are in our U.K.
and France portfolios, which comprise mainly loans with interest-only payments, high loan-to-value ratios at inception and introductory below market rates, have a
delinquency rate of 14%, have a loan-to-value ratio at origination of 82% and have re-indexed loan-to-value ratios of 84% and 64%, respectively. Re-indexed loan-to-value
ratios may not reflect actual realizable values of future repossessions. At December 31, 2013, 11% (based on dollar values) of these loans in our U.K. and France portfolios
have been restructured.
The portfolio of fi nancing receivables, before allowance for losses,
was $258.2 billion at December 31, 2013, and $273.1 billion at
December 31, 2012. Financing receivables, before allowance for
losses, decreased $14.9 billion from December 31, 2012, primarily
as a result of dispositions ($6.5 billion), write-offs ($5.9 billion), col-
lections (which includes sales) exceeding originations ($3.6 billion)
and the stronger U.S. dollar ($1.7 billion).
Related nonearning receivables totaled $7.2 billion (2.8% of
outstanding receivables) at December 31, 2013, compared with
$7.5 billion (2.8% of outstanding receivables) at December 31,
2012. Nonearning receivables decreased from December 31,
2012, primarily due to collections and write-offs at CLL and the
placing of consumer credit card accounts on accrual status,
partially offset by nonearning receivables previously classifi ed
as cash basis resulting from a revision to our nonaccrual and
nonearning methods to more closely align with regulatory guid-
ance in the fourth quarter of 2013.
The allowance for losses at December 31, 2013 totaled
$5.2 billion compared with $4.9 billion at December 31, 2012,
representing our best estimate of probable losses inherent in
the portfolio. Allowance for losses increased $0.2 billion from
December 31, 2012, primarily because provisions were higher
than write-offs, net of recoveries by $0.4 billion, which is attrib-
utable to an increase in provision in our Consumer installment
and revolving portfolios. The allowance for losses as a percent of
total fi nancing receivables increased from 1.8% at December 31,
2012 to 2.0% at December 31, 2013 primarily due to an increase
in the allowance for losses and a decline in the overall fi nancing
receivables balance as discussed above. Further information
surrounding the allowance for losses related to each of our
portfolios follows.