GE 2013 Annual Report Download - page 124
Download and view the complete annual report
Please find page 124 of the 2013 GE annual report below. You can navigate through the pages in the report by either clicking on the pages listed below, or by using the keyword search tool below to find specific information within the annual report.-
 1
1 -
2
-
3
-
4
-
5
-
6
-
7
-
8
-
9
-
10
-
11
-
12
-
13
-
14
-
15
-
16
-
17
-
18
-
19
-
20
-
21
-
22
-
23
-
24
-
25
-
26
-
27
-
28
-
29
-
30
-
31
-
32
-
33
-
34
-
35
-
36
-
37
-
38
-
39
-
40
-
41
-
42
-
43
-
44
-
45
-
46
-
47
-
48
-
49
-
50
-
51
-
52
-
53
-
54
-
55
-
56
-
57
-
58
-
59
-
60
-
61
-
62
-
63
-
64
-
65
-
66
-
67
-
68
-
69
-
70
-
71
-
72
-
73
-
74
-
75
-
76
-
77
-
78
-
79
-
80
-
81
-
82
-
83
-
84
-
85
-
86
-
87
-
88
-
89
-
90
-
91
-
92
-
93
-
94
-
95
-
96
-
97
-
98
-
99
-
100
-
101
-
102
-
103
-
104
-
105
-
106
-
107
-
108
-
109
-
110
-
111
-
112
-
113
-
 114
114 -
 115
115 -
 116
116 -
 117
117 -
 118
118 -
 119
119 -
 120
120 -
 121
121 -
 122
122 -
 123
123 -
 124
124 -
 125
125 -
 126
126 -
 127
127 -
 128
128 -
 129
129 -
 130
130 -
 131
131 -
 132
132 -
 133
133 -
 134
134 -
135
-
136
-
137
-
138
-
139
-
140
-
141
-
142
-
143
-
144
-
145
-
146
-
147
-
148
-
149
-
150
 |
 |

122 GE 2013 ANNUAL REPORT
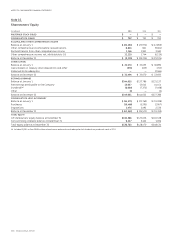
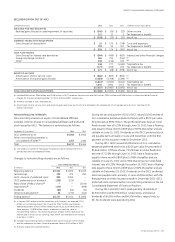
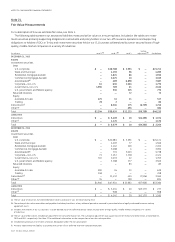
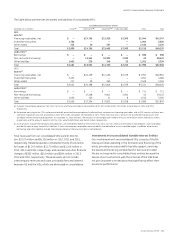
Note 21.
Fair Value Measurements
For a description of how we estimate fair value, see Note 1.
The following tables present our assets and liabilities measured at fair value on a recurring basis. Included in the tables are invest-
ment securities primarily supporting obligations to annuitants and policyholders in our run-off insurance operations and supporting
obligations to holders of GICs in Trinity and investment securities held in our CLL business collateralized by senior secured loans of high-
quality, middle-market companies in a variety of industries.
(In millions) Level 1 (a) Level 2 (a) Level 3
Netting
adjustment (b) Net balance
DECEMBER 31, 2013
ASSETS
Investment securities
Debt
U.S. corporate $ — $ 18,788 $ 2,953 $ — $ 21,741
State and municipal — 4,193 96 — 4,289
Residential mortgage-backed — 1,824 86 — 1,910
Commercial mortgage-backed — 3,025 10 — 3,035
Asset-backed
(c) — 489 6,898 — 7,387
Corporate—non-U.S. 61 645 1,064 — 1,770
Government—non-U.S. 1,590 789 31 — 2,410
U.S. government and federal agency — 545 225 — 770
Retained interests — — 72 — 72
Equity
Available-for-sale 475 31 11 — 517
Trading 78 2 — — 80
Derivatives (d) — 8,304 175 (6,739) 1,740
Other (e) — — 494 — 494
Total $ 2,204 $ 38,635 $ 12,115 $ (6,739) $ 46,215
LIABILITIES
Derivatives $ — $ 5,409 $ 20 $ (4,355) $ 1,074
Other (f) — 1,170 — — 1,170
Total $ — $ 6,579 $ 20 $ (4,355) $ 2,244
DECEMBER 31, 2012
ASSETS
Investment securities
Debt
U.S. corporate $ — $ 20,580 $ 3,591 $ — $ 24,171
State and municipal — 4,469 77 — 4,546
Residential mortgage-backed — 2,162 100 — 2,262
Commercial mortgage-backed — 3,088 6 — 3,094
Asset-backed
(c) — 715 5,023 — 5,738
Corporate—non-U.S. 71 1,132 1,218 — 2,421
Government—non-U.S. 702 1,019 42 — 1,763
U.S. government and federal agency — 3,288 277 — 3,565
Retained interests — — 83 — 83
Equity
Available-for-sale 590 16 13 — 619
Trading 248 — — — 248
Derivatives (d) — 11,432 434 (7,926) 3,940
Other (e) 35 — 799 — 834
Total $ 1,646 $ 47,901 $ 11,663 $ (7,926) $ 53,284
LIABILITIES
Derivatives $ — $ 3,434 $ 20 $ (3,177) $ 277
Other (f) — 908 — — 908
Total $ — $ 4,342 $ 20 $ (3,177) $ 1,185
(a) The fair value of securities transferred between Level 1 and Level 2 was $2 million during 2013.
(b) The netting of derivative receivables and payables (including the effects of any collateral posted or received) is permitted when a legally enforceable master netting
agreement exists.
(c) Includes investments in our CLL business in asset-backed securities collateralized by senior secured loans of high-quality, middle-market companies in a variety
of industries.
(d) The fair value of derivatives included an adjustment for non-performance risk. The cumulative adjustment was a gain (loss) of $(7) million and $(15) million at December 31,
2013 and 2012, respectively. See Note 22 for additional information on the composition of our derivative portfolio.
(e) Included private equity investments and loans designated under the fair value option.
(f) Primarily represented the liability associated with certain of our deferred incentive compensation plans.