GE 2013 Annual Report Download - page 120
Download and view the complete annual report
Please find page 120 of the 2013 GE annual report below. You can navigate through the pages in the report by either clicking on the pages listed below, or by using the keyword search tool below to find specific information within the annual report.-
 1
1 -
2
-
3
-
4
-
5
-
6
-
7
-
8
-
9
-
10
-
11
-
12
-
13
-
14
-
15
-
16
-
17
-
18
-
19
-
20
-
21
-
22
-
23
-
24
-
25
-
26
-
27
-
28
-
29
-
30
-
31
-
32
-
33
-
34
-
35
-
36
-
37
-
38
-
39
-
40
-
41
-
42
-
43
-
44
-
45
-
46
-
47
-
48
-
49
-
50
-
51
-
52
-
53
-
54
-
55
-
56
-
57
-
58
-
59
-
60
-
61
-
62
-
63
-
64
-
65
-
66
-
67
-
68
-
69
-
70
-
71
-
72
-
73
-
74
-
75
-
76
-
77
-
78
-
79
-
80
-
81
-
82
-
83
-
84
-
85
-
86
-
87
-
88
-
89
-
90
-
91
-
92
-
93
-
94
-
95
-
96
-
97
-
98
-
99
-
100
-
101
-
102
-
103
-
104
-
105
-
106
-
107
-
108
-
109
-
 110
110 -
 111
111 -
 112
112 -
 113
113 -
 114
114 -
 115
115 -
 116
116 -
 117
117 -
 118
118 -
 119
119 -
 120
120 -
 121
121 -
 122
122 -
 123
123 -
 124
124 -
 125
125 -
 126
126 -
 127
127 -
 128
128 -
 129
129 -
 130
130 -
131
-
132
-
133
-
134
-
135
-
136
-
137
-
138
-
139
-
140
-
141
-
142
-
143
-
144
-
145
-
146
-
147
-
148
-
149
-
150
 |
 |

118 GE 2013 ANNUAL REPORT
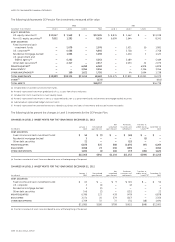
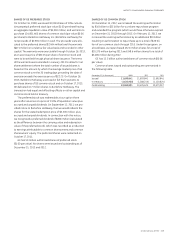
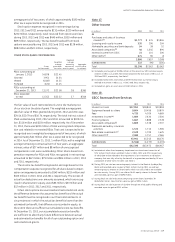
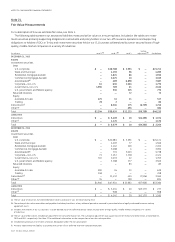
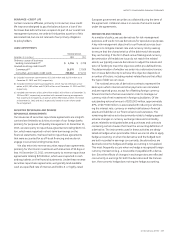
Note 16.
Other Stock-Related Information
We grant stock options, restricted stock units (RSUs) and
performance share units (PSUs) to employees under the 2007
Long-Term Incentive Plan (the Plan). This plan replaced the
1990 Long-Term Incentive Plan. In addition, we grant options
and RSUs in limited circumstances to consultants, advisors and
independent contractors under a plan approved by our Board
of Directors in 1997 (the Consultants’ Plan). Share requirements
for all plans may be met from either unissued or treasury shares.
Stock options expire 10 years from the date they are granted and
vest over service periods that range from one to fi ve years. RSUs
give the recipients the right to receive shares of our stock upon
the vesting of their related restrictions. Restrictions on RSUs vest
in various increments and at various dates, beginning after one
year from date of grant through grantee retirement. Although
the plan permits us to issue RSUs settleable in cash, we have only
issued RSUs settleable in shares of our stock. PSUs give recipients
the right to receive shares of our stock upon the achievement of
certain performance targets.
All grants of GE options under all plans must be approved by
the Management Development and Compensation Committee,
which consists entirely of independent directors.
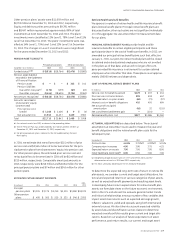
STOCK COMPENSATION PLANS
December 31, 2013 (Shares in thousands)
Securities
to be
issued
upon
exercise
Weighted
average
exercise
price
Securities
available
for future
issuance
APPROVED BY SHAREOWNERS
Options 473,247 $ 20.02 (a)
RSUs 13,572 (b) (a)
PSUs 950 (b) (a)
NOT APPROVED BY SHAREOWNERS
(CONSULTANTS’ PLAN)
Options 364 25.32 (c)
RSUs — (b) (c)
Total 488,133 $ 20.02 404,574
(a) In 2007, the Board of Directors approved the 2007 Long-Term Incentive Plan,
which replaced the 1990 Long-Term Incentive Plan. During 2012, an amendment
was approved to increase the number of shares authorized for issuance under
the Plan from 500 million shares to 925 million shares. No more than 230 million
of the total number of authorized shares may be available for awards granted in
any form provided under the Plan other than options or stock appreciation
rights. Total shares available for future issuance under the Plan amounted to
376.4 million shares at December 31, 2013.
(b) Not applicable.
(c) Total shares available for future issuance under the Consultants’ Plan amount to
28.2 million shares.
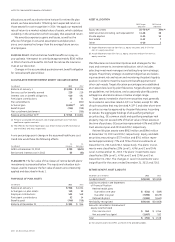
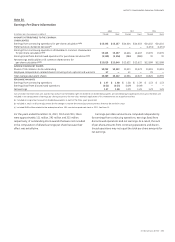
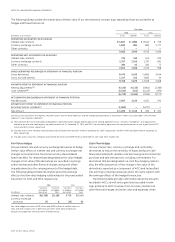
Outstanding options expire on various dates through
December 13, 2023.
The following table summarizes information about stock
options outstanding at December 31, 2013.
STOCK OPTIONS OUTSTANDING
(Shares in thousands) Outstanding Exercisable
Exercise price range Shares
Average
life (a)
Average
exercise
price Shares
Average
exercise
price
Under $10.00 34,973 4.9 $ 9.57 26,995 $ 9.57
10.01–15.00 56,571 5.1 11.98 45,821 11.98
15.01–20.00 172,157 6.8 17.46 91,007 17.24
20.01–25.00 139,740 9.1 22.55 20,533 21.57
25.01–30.00 20,638 4.3 28.19 20,115 28.23
30.01–35.00 35,993 1.6 33.54 35,993 33.54
Over $35.00 13,539 3.3 38.67 13,539 38.67
Total 473,611 6.5 $ 20.02 254,003 $ 20.15
(a) Average contractual life remaining in years.
At year-end 2012, options with a weighted average exercise price
of $20.85 were exercisable on 214 million shares.
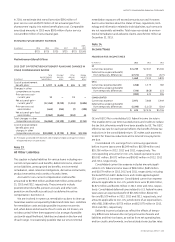
STOCK OPTION ACTIVITY
Shares
(In thousands)
Weighted
average
exercise price
Weighted
average
remaining
contractual
term (In years)
Aggregate
intrinsic value
(In millions)
Outstanding at
January 1, 2013 467,837 $ 19.27
Granted 62,762 23.80
Exercised (36,191) 13.65
Forfeited (9,688) 18.95
Expired (11,109) 31.60
Outstanding at
December 31, 2013 473,611 $ 20.02 6.5 $ 4,140
Exercisable at
December 31, 2013 254,003 $ 20.15 5.1 $ 2,348
Options expected
to vest 200,909 $ 19.79 8.0 $ 1,656
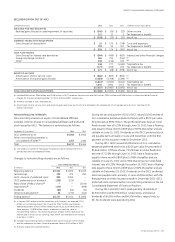
We measure the fair value of each stock option grant at the
date of grant using a Black-Scholes option pricing model. The
weighted average grant-date fair value of options granted during
2013, 2012 and 2011 was $4.52, $3.80 and $4.00, respectively.
The following assumptions were used in arriving at the fair value
of options granted during 2013, 2012 and 2011, respectively:
risk-free interest rates of 2.5%, 1.3% and 2.6%; dividend yields of
4.0%, 4.0% and 3.9%; expected volatility of 28%, 29% and 30%;
and expected lives of 7.5 years, 7.8 years and 7.7 years. Risk-free
interest rates refl ect the yield on zero-coupon U.S. Treasury
securities. Expected dividend yields presume a set dividend
rate and we used a historical fi ve-year average for the dividend
yield. Expected volatilities are based on implied volatilities from
traded options and historical volatility of our stock. The expected
option lives are based on our historical experience of employee
exercise behavior.
The total intrinsic value of options exercised during 2013, 2012
and 2011 amounted to $392 million, $265 million and $65 million,
respectively. As of December 31, 2013, there was $663 million
of total unrecognized compensation cost related to nonvested
options. That cost is expected to be recognized over a weighted