GE 2013 Annual Report Download - page 49
Download and view the complete annual report
Please find page 49 of the 2013 GE annual report below. You can navigate through the pages in the report by either clicking on the pages listed below, or by using the keyword search tool below to find specific information within the annual report.-
 1
1 -
2
-
3
-
4
-
5
-
6
-
7
-
8
-
9
-
10
-
11
-
12
-
13
-
14
-
15
-
16
-
17
-
18
-
19
-
20
-
21
-
22
-
23
-
24
-
25
-
26
-
27
-
28
-
29
-
30
-
31
-
32
-
33
-
34
-
35
-
36
-
37
-
38
-
 39
39 -
 40
40 -
 41
41 -
 42
42 -
 43
43 -
 44
44 -
 45
45 -
 46
46 -
 47
47 -
 48
48 -
 49
49 -
 50
50 -
 51
51 -
 52
52 -
 53
53 -
 54
54 -
 55
55 -
 56
56 -
 57
57 -
 58
58 -
 59
59 -
60
-
61
-
62
-
63
-
64
-
65
-
66
-
67
-
68
-
69
-
70
-
71
-
72
-
73
-
74
-
75
-
76
-
77
-
78
-
79
-
80
-
81
-
82
-
83
-
84
-
85
-
86
-
87
-
88
-
89
-
90
-
91
-
92
-
93
-
94
-
95
-
96
-
97
-
98
-
99
-
100
-
101
-
102
-
103
-
104
-
105
-
106
-
107
-
108
-
109
-
110
-
111
-
112
-
113
-
114
-
115
-
116
-
117
-
118
-
119
-
120
-
121
-
122
-
123
-
124
-
125
-
126
-
127
-
128
-
129
-
130
-
131
-
132
-
133
-
134
-
135
-
136
-
137
-
138
-
139
-
140
-
141
-
142
-
143
-
144
-
145
-
146
-
147
-
148
-
149
-
150
 |
 |

’
GE 2013 ANNUAL REPORT 47
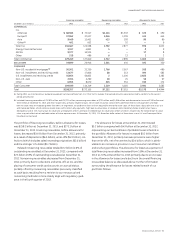
Non-U.S. revenues were $77.4 billion in 2013, compared with
$76.2 billion and $76.6 billion in 2012 and 2011, respectively.
Non-U.S. revenues to external customers as a percentage of
consolidated revenues were 53% in 2013, compared with 52% in
both 2012 and 2011.
GE non-U.S. revenues, excluding GECC, in 2013 were $59.0 bil-
lion, up 3% over 2012. Increases in growth markets of 72% in
Algeria, 38% in Sub-Sahara and 7% in China offset a decrease of
9% in Europe. These revenues as a percentage of GE total rev-
enues, excluding GECC, were 58% in 2013, compared with 57%
and 55% in 2012 and 2011, respectively.
GE non-U.S. revenues, excluding GECC, were $57.3 billion
in 2012, up 5% from 2011, primarily resulting from increases of
22% in Australia and New Zealand, 20% in China and 8% in Latin
America, partially offset by a decrease of 36% in India. The effects
of currency fl uctuations on reported results decreased reve-
nues by $0.3 billion in 2013, primarily driven by the Japanese yen
($0.3 billion) and Brazilian real ($0.2 billion), partially offset by the
euro ($0.4 billion). The effect of currency fl uctuations on reported
results decreased revenues by $1.9 billion in 2012, primarily
driven by the euro ($1.4 billion) and Brazilian real ($0.2 billion). The
effects of currency fl uctuations on reported results increased
revenues by $1.4 billion in 2011, primarily driven by the euro
($0.8 billion) and Japanese yen ($0.2 billion).
GECC non-U.S. revenues decreased 3% to $18.4 billion in 2013,
compared with $19.0 billion and $22.3 billion in 2012 and 2011,
respectively, primarily as a result of decreases in Europe. Non-U.S.
revenues as a percentage of total revenues were 42% in 2013 and
2012, compared with 46% in 2011.
Non-U.S. revenues decreased by 15% in 2012 from $22.3 bil-
lion in 2011, primarily as a result of decreases in Europe. The
effects of currency fl uctuations on reported results decreased
revenues by $0.2 billion in 2013, primarily driven by the Japanese
yen ($0.2 billion). The effects of currency fl uctuations on reported
results decreased revenues by $0.7 billion in 2012, primarily
driven by the euro ($0.3 billion), Polish zloty ($0.1 billion),
Hungarian forint ($0.1 billion) and Czech koruna ($0.1 billion). The
effects of currency fl uctuations on reported results increased
revenues by $1.0 billion in 2011, primarily driven by the Australian
dollar ($0.3 billion), euro ($0.2 billion), Japanese yen ($0.1 billion),
Canadian dollar ($0.1 billion) and British pound ($0.1 billion).
The effects of foreign currency fl uctuations on earnings were
minimal, with no single currency having a signifi cant impact.
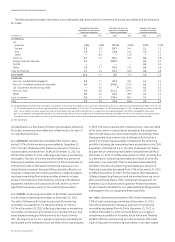
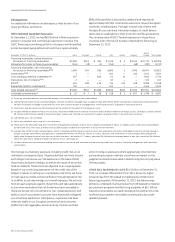
TOTAL ASSETS (CONTINUING OPERATIONS)
December 31 (In billions) 2013 2012
U.S. $ 325.4 $ 350.7
Europe 195.1 188.9
Pacific Basin 51.8 55.7
Americas 32.9 32.9
Other Global 49.0 53.5
Total $ 654.2 $ 681.7
Total assets of non-U.S. operations on a continuing basis were
$328.8 billion in 2013, a decrease of $2.2 billion from 2012. This
decrease refl ected declines in Pacifi c Basin and Other Global,
primarily due to the strengthening of the U.S. dollar against the
Japanese yen and dispositions at various businesses, partially
offset by increases in Europe, primarily due to acquisitions.
Financial results of our non-U.S. activities reported in U.S.
dollars are affected by currency exchange. We use a number of
techniques to manage the effects of currency exchange, includ-
ing selective borrowings in local currencies and selective hedging
of signifi cant cross-currency transactions. Such principal curren-
cies are the pound sterling, the euro, the Japanese yen, the Swiss
franc and the Australian dollar.
Environmental Matters
Our operations, like operations of other companies engaged in
similar businesses, involve the use, disposal and cleanup of sub-
stances regulated under environmental protection laws. We are
involved in a number of remediation actions to clean up hazard-
ous wastes as required by federal and state laws. Such statutes
require that responsible parties fund remediation actions regard-
less of fault, legality of original disposal or ownership of a disposal
site. Expenditures for site remediation actions amounted to
approximately $0.4 billion in both 2013 and 2012 and $0.3 billion
in 2011. We presently expect that such remediation actions will
require average annual expenditures of about $0.4 billion for each
of the next two years.
In 2006, we entered into a consent decree with the
Environmental Protection Agency (EPA) to dredge PCB-containing
sediment from the upper Hudson River. The consent decree
provided that the dredging would be performed in two phases.
Phase 1 was completed in May through November of 2009.
Between Phase 1 and Phase 2 there was an intervening peer
review by an independent panel of national experts. The panel
evaluated the performance of Phase 1 dredging operations
with respect to Phase 1 Engineering Performance Standards
and recommended proposed changes to the standards. On
December 17, 2010, EPA issued its decision setting forth the fi nal
performance standards for Phase 2 of the Hudson River dredging
project, incorporating aspects of the recommendations from the
independent peer review panel and from GE. In December 2010,
we agreed to perform Phase 2 of the project in accordance with
the fi nal performance standards set by EPA and increased our
reserve by $0.8 billion in the fourth quarter of 2010 to account for
the probable and estimable costs of completing Phase 2. In 2011,
we completed the fi rst year of Phase 2 dredging and commenced
work on planned upgrades to the Hudson River wastewater
processing facility. Over the past three years we have dredged
1.7 million cubic yards from the river and, based upon that result
and our best professional engineering judgment, we believe that
our current reserve continues to refl ect our probable and estima-
ble costs for the remainder of Phase 2 of the dredging project.