GE 2013 Annual Report Download - page 54
Download and view the complete annual report
Please find page 54 of the 2013 GE annual report below. You can navigate through the pages in the report by either clicking on the pages listed below, or by using the keyword search tool below to find specific information within the annual report.-
 1
1 -
2
-
3
-
4
-
5
-
6
-
7
-
8
-
9
-
10
-
11
-
12
-
13
-
14
-
15
-
16
-
17
-
18
-
19
-
20
-
21
-
22
-
23
-
24
-
25
-
26
-
27
-
28
-
29
-
30
-
31
-
32
-
33
-
34
-
35
-
36
-
37
-
38
-
39
-
40
-
41
-
42
-
43
-
 44
44 -
 45
45 -
 46
46 -
 47
47 -
 48
48 -
 49
49 -
 50
50 -
 51
51 -
 52
52 -
 53
53 -
 54
54 -
 55
55 -
 56
56 -
 57
57 -
 58
58 -
 59
59 -
 60
60 -
 61
61 -
 62
62 -
 63
63 -
 64
64 -
65
-
66
-
67
-
68
-
69
-
70
-
71
-
72
-
73
-
74
-
75
-
76
-
77
-
78
-
79
-
80
-
81
-
82
-
83
-
84
-
85
-
86
-
87
-
88
-
89
-
90
-
91
-
92
-
93
-
94
-
95
-
96
-
97
-
98
-
99
-
100
-
101
-
102
-
103
-
104
-
105
-
106
-
107
-
108
-
109
-
110
-
111
-
112
-
113
-
114
-
115
-
116
-
117
-
118
-
119
-
120
-
121
-
122
-
123
-
124
-
125
-
126
-
127
-
128
-
129
-
130
-
131
-
132
-
133
-
134
-
135
-
136
-
137
-
138
-
139
-
140
-
141
-
142
-
143
-
144
-
145
-
146
-
147
-
148
-
149
-
150
 |
 |

’
52 GE 2013 ANNUAL REPORT
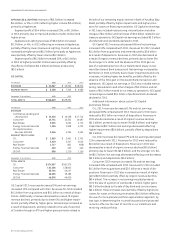
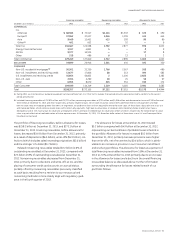
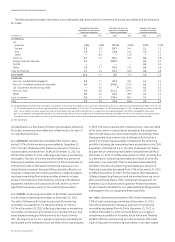
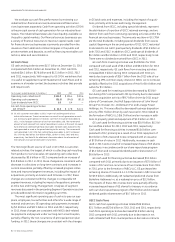
The following table provides information surrounding selected ratios related to nonearning fi nancing receivables and the allowance
for losses.
Nonearning financing
receivables as a percent of
financing receivables
Allowance for losses as
a percent of nonearning
financing receivables
Allowance for losses
as a percent of total
financing receivables
December 31 2013 2012 2013 2012 2013 2012
COMMERCIAL
CLL
Americas 1.8% 1.8% 38.1% 36.8% 0.7% 0.7%
Europe 2.8 3.5 39.7 34.3 1.1 1.2
Asia 4.4 1.7 21.8 41.5 1.0 0.7
Other — 8.6 — 11.5 — 1.0
Total CLL 2.3 2.4 36.2 35.5 0.8 0.8
Energy Financial Services 0.1 — 200.0 — 0.3 0.2
GECAS — — — — 0.2 0.1
Other 1.9 2.7 33.3 23.1 0.6 0.6
Total Commercial 2.1 2.1 37.1 36.0 0.8 0.8
REAL ESTATE 11.6 2.1 8.3 72.1 1.0 1.5
CONSUMER
Non-U.S. residential mortgages
(a) 5.8 7.7 20.3 18.7 1.2 1.4
Non-U.S. installment and revolving credit 0.6 1.2 675.0 273.2 4.3 3.3
U.S. installment and revolving credit — 2.0 (b) 222.4 5.1 4.5
Non-U.S. auto 0.9 0.6 311.1 279.2 2.7 1.6
Other 5.0 4.3 43.5 49.0 2.2 2.1
Total Consumer 2.0 3.7 179.4 85.7 3.7 3.1
Total 2.8 2.8 71.6 65.8 2.0 1.8
(a) Included nonearning financing receivables as a percent of financing receivables of 6.2% and 8.5%, allowance for losses as a percent of nonearning receivables of 18.5% and
13.7% and allowance for losses as a percent of total financing receivables of 1.2% and 1.2% at December 31, 2013 and December 31, 2012, respectively, primarily related to
loans, net of credit insurance, whose terms permitted interest-only payments and high loan-to-value ratios at inception (greater than 90%). Compared to the overall
Non-U.S. residential mortgage loan portfolio, the ratio of allowance for losses as a percent of nonearning financing receivables for these loans is lower, driven primarily by
the higher mix of such products in the U.K. and France portfolios and as a result of the better performance and collateral realization experience in these markets.
(b) Not meaningful.
Included below is a discussion of fi nancing receivables, allowance
for losses, nonearning receivables and related metrics for each of
our signifi cant portfolios.
CLL—AMERICAS. Nonearning receivables of $1.2 billion repre-
sented 17.2% of total nonearning receivables at December 31,
2013. The ratio of allowance for losses as a percent of nonearn-
ing receivables increased from 36.8% at December 31, 2012, to
38.1% at December 31, 2013, refl ecting a decrease in nonearning
receivables. The ratio of nonearning receivables as a percent of
fi nancing receivables remained constant at 1.8% at December 31,
2013 primarily due to decreased nonearning exposures in our
industrial and consumer-facing portfolios, partially offset by our
materials, media and Latin America portfolios. Collateral support-
ing these nonearning fi nancing receivables primarily includes
assets in the restaurant and hospitality, trucking and industrial
equipment industries and corporate aircraft, and for our lever-
aged fi nance business, equity of the underlying businesses.
CLL—EUROPE. Nonearning receivables of $1.0 billion represented
14.5% of total nonearning receivables at December 31, 2013.
The ratio of allowance for losses as a percent of nonearning
receivables increased from 34.3% at December 31, 2012 to
39.7% at December 31, 2013, refl ecting a decrease in nonearning
receivables and allowance for losses in our Interbanca S.p.A. and
asset-backed lending portfolios primarily as a result of write-
offs. The majority of our CLL—Europe nonearning receivables are
attributable to the Interbanca S.p.A. portfolio, which was acquired
in 2009. The loans acquired with Interbanca S.p.A. were recorded
at fair value, which incorporates an estimate at the acquisition
date of credit losses over their remaining life. Accordingly, these
loans generally have a lower ratio of allowance for losses as a
percent of nonearning receivables compared to the remaining
portfolio. Excluding the nonearning loans attributable to the 2009
acquisition of Interbanca S.p.A., the ratio of allowance for losses
as a percent of nonearning receivables increased from 58.4% at
December 31, 2012, to 70.8% at December 31, 2013, primarily due
to a decrease in nonearning receivables as a result of write-offs
and sales in our acquisition fi nance and asset-backed lending
portfolios. The ratio of nonearning receivables as a percent of
fi nancing receivables decreased from 3.5% at December 31, 2012,
to 2.8% at December 31, 2013, for the reasons described above.
Collateral supporting these secured nonearning fi nancing receiv-
ables are primarily equity of the underlying businesses for our
Interbanca S.p.A. business and acquisition fi nance businesses,
the purchased receivables for our asset-backed lending portfolio,
and equipment for our equipment fi nance portfolio.
CLL—ASIA. Nonearning receivables of $0.4 billion represented
5.7% of total nonearning receivables at December 31, 2013.
The ratio of allowance for losses as a percent of nonearning
receivables decreased from 41.5% at December 31, 2012, to
21.8% at December 31, 2013, primarily due to an increase in
nonearning receivables in Australia, South Korea and Thailand,
partially offset by restructuring activities and write-offs result-
ing in a reduction of nonearning receivables in our asset-based