GE 2013 Annual Report Download - page 116
Download and view the complete annual report
Please find page 116 of the 2013 GE annual report below. You can navigate through the pages in the report by either clicking on the pages listed below, or by using the keyword search tool below to find specific information within the annual report.-
 1
1 -
2
-
3
-
4
-
5
-
6
-
7
-
8
-
9
-
10
-
11
-
12
-
13
-
14
-
15
-
16
-
17
-
18
-
19
-
20
-
21
-
22
-
23
-
24
-
25
-
26
-
27
-
28
-
29
-
30
-
31
-
32
-
33
-
34
-
35
-
36
-
37
-
38
-
39
-
40
-
41
-
42
-
43
-
44
-
45
-
46
-
47
-
48
-
49
-
50
-
51
-
52
-
53
-
54
-
55
-
56
-
57
-
58
-
59
-
60
-
61
-
62
-
63
-
64
-
65
-
66
-
67
-
68
-
69
-
70
-
71
-
72
-
73
-
74
-
75
-
76
-
77
-
78
-
79
-
80
-
81
-
82
-
83
-
84
-
85
-
86
-
87
-
88
-
89
-
90
-
91
-
92
-
93
-
94
-
95
-
96
-
97
-
98
-
99
-
100
-
101
-
102
-
103
-
104
-
105
-
 106
106 -
 107
107 -
 108
108 -
 109
109 -
 110
110 -
 111
111 -
 112
112 -
 113
113 -
 114
114 -
 115
115 -
 116
116 -
 117
117 -
 118
118 -
 119
119 -
 120
120 -
 121
121 -
 122
122 -
 123
123 -
 124
124 -
 125
125 -
 126
126 -
127
-
128
-
129
-
130
-
131
-
132
-
133
-
134
-
135
-
136
-
137
-
138
-
139
-
140
-
141
-
142
-
143
-
144
-
145
-
146
-
147
-
148
-
149
-
150
 |
 |

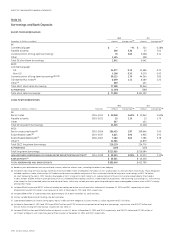
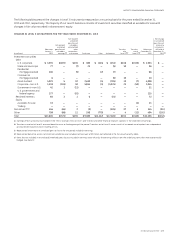
114 GE 2013 ANNUAL REPORT
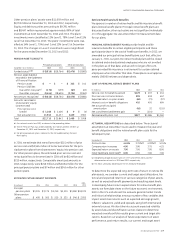
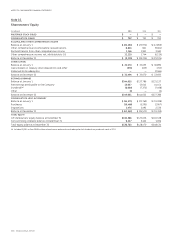
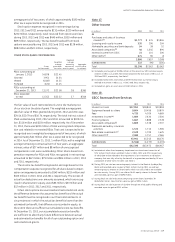
Note 15.
Shareowners’ Equity
(In millions) 2013 2012 2011
PREFERRED STOCK ISSUED $ — $ — $ —
COMMON STOCK ISSUED $ 702 $ 702 $ 702
ACCUMULATED OTHER COMPREHENSIVE INCOME
Balance at January 1 $ (20,230) $ (23,974) $ (17,855)
Other comprehensive income before reclassifications 8,844 841 (9,601)
Reclassifications from other comprehensive income 2,266 2,903 3,482
Other comprehensive income, net, attributable to GE 11,110 3,744 (6,119)
Balance at December 31 $ (9,120) $ (20,230) $ (23,974)
OTHER CAPITAL
Balance at January 1 $ 33,070 $ 33,693 $ 36,890
Gains (losses) on treasury stock dispositions and other (576) (623) (703)
Preferred stock redemption — — (2,494)
Balance at December 31 $ 32,494 $ 33,070 $ 33,693
RETAINED EARNINGS
Balance at January 1 $ 144,055 $ 137,786 $ 131,137
Net earnings attributable to the Company 13,057 13,641 14,151
Dividends (a) (8,060) (7,372) (7,498)
Other (1) — (4
)
Balance at December 31 $ 149,051 $ 144,055 $ 137,786
COMMON STOCK HELD IN TREASURY
Balance at January 1 $ (34,571) $ (31,769) $ (31,938)
Purchases (10,466) (5,295) (2,067)
Dispositions 2,476 2,493 2,236
Balance at December 31 $ (42,561) $ (34,571) $ (31,769)
TOTAL EQUITY
GE shareowners’ equity balance at December 31 $ 130,566 $ 123,026 $ 116,438
Noncontrolling interests balance at December 31 6,217 5,444 1,696
Total equity balance at December 31 $ 136,783 $ 128,470 $ 118,134
(a) Included $1,031 million ($806 million related to our preferred stock redemption) of dividends on preferred stock in 2011.