GE 2013 Annual Report Download - page 141
Download and view the complete annual report
Please find page 141 of the 2013 GE annual report below. You can navigate through the pages in the report by either clicking on the pages listed below, or by using the keyword search tool below to find specific information within the annual report.-
 1
1 -
2
-
3
-
4
-
5
-
6
-
7
-
8
-
9
-
10
-
11
-
12
-
13
-
14
-
15
-
16
-
17
-
18
-
19
-
20
-
21
-
22
-
23
-
24
-
25
-
26
-
27
-
28
-
29
-
30
-
31
-
32
-
33
-
34
-
35
-
36
-
37
-
38
-
39
-
40
-
41
-
42
-
43
-
44
-
45
-
46
-
47
-
48
-
49
-
50
-
51
-
52
-
53
-
54
-
55
-
56
-
57
-
58
-
59
-
60
-
61
-
62
-
63
-
64
-
65
-
66
-
67
-
68
-
69
-
70
-
71
-
72
-
73
-
74
-
75
-
76
-
77
-
78
-
79
-
80
-
81
-
82
-
83
-
84
-
85
-
86
-
87
-
88
-
89
-
90
-
91
-
92
-
93
-
94
-
95
-
96
-
97
-
98
-
99
-
100
-
101
-
102
-
103
-
104
-
105
-
106
-
107
-
108
-
109
-
110
-
111
-
112
-
113
-
114
-
115
-
116
-
117
-
118
-
119
-
120
-
121
-
122
-
123
-
124
-
125
-
126
-
127
-
128
-
129
-
130
-
 131
131 -
 132
132 -
 133
133 -
 134
134 -
 135
135 -
 136
136 -
 137
137 -
 138
138 -
 139
139 -
 140
140 -
 141
141 -
 142
142 -
 143
143 -
 144
144 -
 145
145 -
 146
146 -
 147
147 -
 148
148 -
 149
149 -
 150
150
 |
 |

GE 2013 ANNUAL REPORT 139
Financial Measures that Supplement Generally
Accepted Accounting Principles
We sometimes use information derived from consolidated
fi nancial information but not presented in our fi nancial state-
ments prepared in accordance with U.S. generally accepted
accounting principles (GAAP). Certain of these data are consid-
ered “non-GAAP fi nancial measures” under U.S. Securities and
Exchange Commission rules. Specifi cally, we have referred, in
various sections of this Annual Report, to:
• Industrial cash fl ows from operating activities (Industrial CFOA)
and GE CFOA excluding the effects of NBCU deal-related taxes
• Operating earnings, operating EPS, operating EPS exclud-
ing the effects of the 2011 preferred stock redemption and
Industrial operating earnings
• Operating and non-operating pension costs
• Average GE shareowners’ equity, excluding effects of
discontinued operations
• Ratio of adjusted debt to equity at GECC, net of adjusted
cash and equivalents and with classifi cation of hybrid debt
as equity
• GE Capital ending net investment (ENI), excluding cash
and equivalents
• GE pre-tax earnings from continuing operations, excluding
GECC earnings from continuing operations, the correspond-
ing effective tax rates and the reconciliation of the U.S. federal
statutory income tax rate to GE effective tax rate, excluding
GECC earnings
The reasons we use these non-GAAP fi nancial measures and the
reconciliations to their most directly comparable GAAP fi nancial
measures follow.
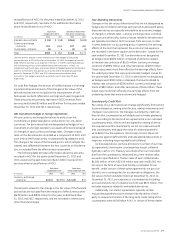
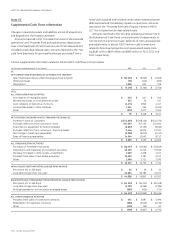
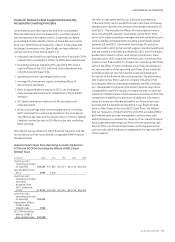
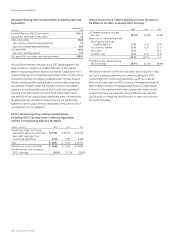
Industrial Cash Flows from Operating Activities (Industrial
CFOA) and GE CFOA Excluding the Effects of NBCU Deal-
Related Taxes
(In millions) 2013 2012 2011 2010 2009
Cash from GE’s
operating activities,
as reported $ 14,255 $ 17,826 $ 12,057 $ 14,746 $ 16,405
Less dividends from
GECC 5,985 6,426 — — —
Cash from GE’s
operating activities,
excluding
dividends from
GECC (Industrial
CFOA) $ 8,270 $ 11,400 $ 12,057 $ 14,746 $ 16,405
Cash from GE’s
operating activities,
as reported $ 14,255
Adjustment: effects
of NBCU deal-
related taxes 3,184
GE CFOA excluding
effects of NBCU
deal-related taxes $ 17,439
We refer to cash generated by our industrial businesses as
“Industrial CFOA,” which we defi ne as GE’s cash from continuing
operating activities less the amount of dividends received by GE
from GECC. This includes the effects of intercompany transac-
tions, including GE customer receivables sold to GECC; GECC
services for trade receivables management and material procure-
ment; buildings and equipment (including automobiles) leased
between GE and GECC; information technology (IT) and other
services sold to GECC by GE; aircraft engines manufactured by GE
that are installed on aircraft purchased by GECC from third-party
producers for lease to others; and various investments, loans
and allocations of GE corporate overhead costs. We believe that
investors may fi nd it useful to compare GE’s operating cash fl ows
without the effect of GECC dividends, since these dividends are
not representative of the operating cash fl ows of our industrial
businesses and can vary from period-to-period based upon
the results of the fi nancial services businesses. We also believe
that investors may fi nd it useful to compare Industrial CFOA
excluding the effects of taxes paid related to the NBCU transac-
tion. Management recognizes that these measures may not be
comparable to cash fl ow results of companies that contain both
industrial and fi nancial services businesses, but believes that this
comparison is aided by the provision of additional information
about the amounts of dividends paid by our fi nancial services
business and the separate presentation in our fi nancial state-
ments of the Financial Services (GECC) cash fl ows. We believe
that our measures of Industrial CFOA and CFOA excluding NBCU
deal-related taxes provide management and investors with
useful measures to compare the capacity of our industrial opera-
tions to generate operating cash fl ows with the operating cash
fl ows of other non-fi nancial businesses and companies and as
such provide useful measures to supplement the reported GAAP
CFOA measure.