Family Dollar 2013 Annual Report Download - page 67
Download and view the complete annual report
Please find page 67 of the 2013 Family Dollar annual report below. You can navigate through the pages in the report by either clicking on the pages listed below, or by using the keyword search tool below to find specific information within the annual report.-
 1
1 -
2
-
3
-
4
-
5
-
6
-
7
-
8
-
9
-
10
-
11
-
12
-
13
-
14
-
15
-
16
-
17
-
18
-
19
-
20
-
21
-
22
-
23
-
24
-
25
-
26
-
27
-
28
-
29
-
30
-
31
-
32
-
33
-
34
-
35
-
36
-
37
-
38
-
39
-
40
-
41
-
42
-
43
-
44
-
45
-
46
-
47
-
48
-
49
-
50
-
51
-
52
-
53
-
54
-
55
-
56
-
 57
57 -
 58
58 -
 59
59 -
 60
60 -
 61
61 -
 62
62 -
 63
63 -
 64
64 -
 65
65 -
 66
66 -
 67
67 -
 68
68 -
 69
69 -
 70
70 -
 71
71 -
 72
72 -
 73
73 -
 74
74 -
 75
75 -
 76
76 -
 77
77 -
78
-
79
-
80
-
81
-
82
-
83
-
84
-
85
-
86
-
87
-
88
 |
 |

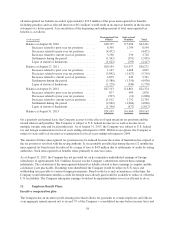
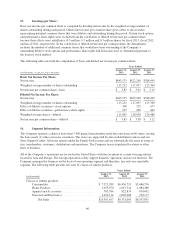
were 8.8 million shares remaining available for grant under the 2006 Plan. The Company also issues shares under
the 2006 Plan in connection with director compensation. These shares are currently issued out of treasury stock
and are not material.
The Company’s results for fiscal 2013, fiscal 2012 and fiscal 2011 include stock-based compensation expense of
$16.3 million, $15.9 million and $14.7 million, respectively. These amounts are included within SG&A on the
Consolidated Statements of Income. Tax benefits recognized in fiscal 2013, fiscal 2012 and fiscal 2011 for stock-
based compensation totaled $6.2 million, $5.9 million and $5.4 million, respectively.
Stock Options
The Company grants stock options to key employees at prices not less than the fair market value of the
Company’s common stock on the grant date. The Company’s practice for a number of years has been to make a
single annual grant to all employees participating in the stock option program and generally to make other grants
only in connection with employment or promotions. Options expire five years from the grant date and are
exercisable to the extent of 40% after the second anniversary of the grant and an additional 30% at each of the
following two anniversary dates on a cumulative basis. Compensation cost is recognized on a straight-line basis,
net of estimated forfeitures, over the requisite service period. The Company uses the Black-Scholes option-
pricing model to estimate the grant-date fair value of each option. The fair values of options granted were
estimated using the following weighted-average assumptions:
Years Ended
August 31, 2013 August 25, 2012 August 27, 2011
Expected dividend yield ...................... 1.41% 1.56% 1.56%
Expected stock price volatility ................. 33.2% 34.5% 33.8%
Weighted average risk-free interest rate ......... 0.58% 0.74% 1.01%
Expected life of options (years) ................ 4.39 4.39 4.42
The expected dividend yield is based on the projected annual dividend payment per share divided by the stock
price on the grant date. Expected stock price volatility is derived from an analysis of the historical and implied
volatility of the Company’s publicly traded stock. The risk-free interest rate is based on the U.S. Treasury rates
on the grant date with maturity dates approximating the expected life of the option on the grant date. The
expected life of the options is based on an analysis of historical and expected future exercise behavior, as well as
certain demographic characteristics. These assumptions are evaluated and revised for future grants, as necessary,
to reflect market conditions and experience. There were no significant changes made to the methodology used to
determine the assumptions during fiscal 2013. The weighted-average grant-date fair value of stock options
granted was $16.47 during fiscal 2013, $13.10 during fiscal 2012 and $11.60 during fiscal 2011.
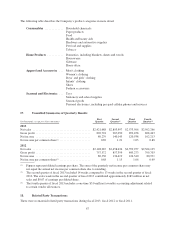
The following table summarizes the transactions under the stock option plans during fiscal 2013:
(in thousands, except per share amounts)
Options
Outstanding
Weighted-
Average Exercise
Price
Weighted-Average
Remaining
Contractual Life in
Years
Aggregate Intrinsic
Value
Balance at August 25, 2012 .............. 2,017 $37.60
Granted ............................. 530 67.66
Exercised ............................ (755) 27.55
Forfeited ............................. (123) 51.79
Expired .............................. (5) 28.58
Balance at August 31, 2013 .............. 1,664 $50.71 2.83 $30,085
Exercisable at August 31, 2013 ........... 236 $33.97 1.43 $ 8,771
63