Family Dollar 2013 Annual Report Download - page 44
Download and view the complete annual report
Please find page 44 of the 2013 Family Dollar annual report below. You can navigate through the pages in the report by either clicking on the pages listed below, or by using the keyword search tool below to find specific information within the annual report.-
 1
1 -
2
-
3
-
4
-
5
-
6
-
7
-
8
-
9
-
10
-
11
-
12
-
13
-
14
-
15
-
16
-
17
-
18
-
19
-
20
-
21
-
22
-
23
-
24
-
25
-
26
-
27
-
28
-
29
-
30
-
31
-
32
-
33
-
 34
34 -
 35
35 -
 36
36 -
 37
37 -
 38
38 -
 39
39 -
 40
40 -
 41
41 -
 42
42 -
 43
43 -
 44
44 -
 45
45 -
 46
46 -
 47
47 -
 48
48 -
 49
49 -
 50
50 -
 51
51 -
 52
52 -
 53
53 -
 54
54 -
55
-
56
-
57
-
58
-
59
-
60
-
61
-
62
-
63
-
64
-
65
-
66
-
67
-
68
-
69
-
70
-
71
-
72
-
73
-
74
-
75
-
76
-
77
-
78
-
79
-
80
-
81
-
82
-
83
-
84
-
85
-
86
-
87
-
88
 |
 |

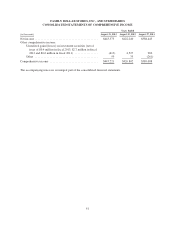
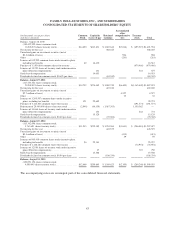
FAMILY DOLLAR STORES, INC., AND SUBSIDIARIES
CONSOLIDATED STATEMENTS OF INCOME
Years Ended
(in thousands, except per share amounts) August 31, 2013 August 25, 2012 August 27, 2011
Net sales ............................................. $10,391,457 $9,331,005 $8,547,835
Cost and expenses: .....................................
Cost of sales ...................................... 6,836,712 6,071,058 5,515,540
Selling, general and administrative .................... 2,866,788 2,584,234 2,409,522
Litigation charge .................................. — 11,500 —
Cost of sales and operating expenses ....................... 9,703,500 8,666,792 7,925,062
Operating profit ....................................... 687,957 664,213 622,773
Investment income ..................................... 422 927 1,532
Interest expense ....................................... 25,888 25,090 22,446
Other income ......................................... 28,206 23,888 15,299
Income before income taxes ............................. 690,697 663,938 617,158
Income taxes ......................................... 247,122 241,698 228,713
Net income ........................................... $ 443,575 $ 422,240 $ 388,445
Net income per common share—basic ..................... $ 3.85 $ 3.61 $ 3.15
Weighted average shares—basic ...................... 115,252 117,097 123,360
Net income per common share—diluted .................... $ 3.83 $ 3.58 $ 3.12
Weighted average shares—diluted .................... 115,805 118,058 124,486
The accompanying notes are an integral part of the consolidated financial statements.
40