Family Dollar 2013 Annual Report Download - page 36
Download and view the complete annual report
Please find page 36 of the 2013 Family Dollar annual report below. You can navigate through the pages in the report by either clicking on the pages listed below, or by using the keyword search tool below to find specific information within the annual report.-
 1
1 -
2
-
3
-
4
-
5
-
6
-
7
-
8
-
9
-
10
-
11
-
12
-
13
-
14
-
15
-
16
-
17
-
18
-
19
-
20
-
21
-
22
-
23
-
24
-
25
-
 26
26 -
 27
27 -
 28
28 -
 29
29 -
 30
30 -
 31
31 -
 32
32 -
 33
33 -
 34
34 -
 35
35 -
 36
36 -
 37
37 -
 38
38 -
 39
39 -
 40
40 -
 41
41 -
 42
42 -
 43
43 -
 44
44 -
 45
45 -
 46
46 -
47
-
48
-
49
-
50
-
51
-
52
-
53
-
54
-
55
-
56
-
57
-
58
-
59
-
60
-
61
-
62
-
63
-
64
-
65
-
66
-
67
-
68
-
69
-
70
-
71
-
72
-
73
-
74
-
75
-
76
-
77
-
78
-
79
-
80
-
81
-
82
-
83
-
84
-
85
-
86
-
87
-
88
 |
 |
with amortization that began on September 27, 2011, and bears interest at a rate of 5.24% per annum from the
date of issuance. The second tranche has a required principal payment of $16.2 million on September 27, 2011,
and on each September 27 thereafter to and including September 27, 2015. Interest on the 2015 Notes is payable
semi-annually in arrears on the 27th day of March and September of each year. The 2015 Notes contain certain
restrictive financial covenants, which include a consolidated debt to consolidated total capitalization ratio, a fixed
charge coverage ratio, and a priority debt to consolidated net worth ratio. As of August 31, 2013, the Company
was in compliance with all such covenants.
Principal Payment
During the first quarter of fiscal 2013, we made a scheduled principal payment on our private placement
notes in the amount of $16.2 million. The next principal payment of $16.2 million was paid in September 2013.
Other Considerations
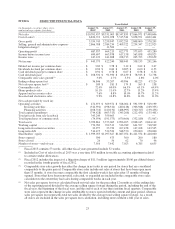
Our merchandise inventories at the end of fiscal 2013 were 2.9% greater than at the end of fiscal
2012. Inventory per store at the end of fiscal 2013 was 3.3% lower than inventory per store at the end of fiscal
2012, which was a result of our efforts to manage inventory levels in our stores.
Capital expenditures for fiscal 2013 were $744.4 million, compared with $603.3 million in fiscal 2012, and
$345.3 million in fiscal 2011. The growth in capital expenditures during fiscal 2013, as compared to fiscal 2012,
was primarily related to increased investments in new stores, including investments in fee development stores. In
fiscal 2013 we spent $385.2 million related to new stores; $149.1 million on our store renovation program;
$76.0 million to support our supply chain, including the completion of our eleventh distribution center;
$81.1 million related to corporate and technology investments; and $53.0 million on existing stores. The increase
in capital expenditures during fiscal 2012, as compared to fiscal 2011, was due primarily to increased new store
openings (including stores opened under our Fee Development Program), the completion of the construction of
our tenth distribution center, investments in fixtures to support our expanded assortment of consumables, and
investments related to renovations, relocations and expansions. In fiscal 2012, we spent $203.0 million on new
stores; $160.9 million on our store renovation program; $99.9 million on existing stores; $89.4 million to support
our supply chain, including the completion of construction of our tenth distribution center and the start of
construction of our eleventh distribution center; and $50.1 million related to corporate and technology
investments.
During fiscal 2013, we purchased 1.2 million shares of our common stock at a cost of $75.0 million,
compared to 3.2 million shares at a cost of $191.6 million in fiscal 2012, and 13.9 million shares at a cost of
$670.5 million in fiscal 2011. On January 17, 2013, the Company announced that the Board of Directors
authorized the Company to purchase up to an additional $300 million of the Company’s outstanding common
stock. On September 28, 2011, the Company announced that the Board of Directors authorized the Company to
purchase up to $250 million of the Company’s outstanding common stock. As of August 31, 2013, the Company
had $370.8 million remaining under current share repurchase authorizations.
The timing and amount of any shares repurchased have been and will continue to be determined by
management based on its evaluation of market conditions and other factors. Our share repurchase programs do
not have a stated expiration date, and purchases may be made through open market purchases, private market
transactions or other structured transactions.
In addition to the Restricted Cash and Investments noted above, our wholly-owned captive insurance
subsidiary maintains additional balances in cash and cash equivalents and investment securities that are used in
connection with our retained workers’ compensation, general liability and automobile liability risks and are not
designated for general corporate purposes. As of the end of fiscal 2013, these cash and cash equivalents and
investment securities balances (including Restricted Cash and Investments) were $3.1 million and $82.0 million,
respectively.
32