Family Dollar 2013 Annual Report Download - page 27
Download and view the complete annual report
Please find page 27 of the 2013 Family Dollar annual report below. You can navigate through the pages in the report by either clicking on the pages listed below, or by using the keyword search tool below to find specific information within the annual report.-
 1
1 -
2
-
3
-
4
-
5
-
6
-
7
-
8
-
9
-
10
-
11
-
12
-
13
-
14
-
15
-
16
-
 17
17 -
 18
18 -
 19
19 -
 20
20 -
 21
21 -
 22
22 -
 23
23 -
 24
24 -
 25
25 -
 26
26 -
 27
27 -
 28
28 -
 29
29 -
 30
30 -
 31
31 -
 32
32 -
 33
33 -
 34
34 -
 35
35 -
 36
36 -
 37
37 -
38
-
39
-
40
-
41
-
42
-
43
-
44
-
45
-
46
-
47
-
48
-
49
-
50
-
51
-
52
-
53
-
54
-
55
-
56
-
57
-
58
-
59
-
60
-
61
-
62
-
63
-
64
-
65
-
66
-
67
-
68
-
69
-
70
-
71
-
72
-
73
-
74
-
75
-
76
-
77
-
78
-
79
-
80
-
81
-
82
-
83
-
84
-
85
-
86
-
87
-
88
 |
 |

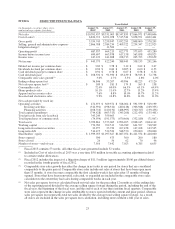
ITEM 6. SELECTED FINANCIAL DATA
Years Ended
(in thousands, except per share, store,
and net sales per square foot data)
August 31,
2013*
August 25,
2012
August 27,
2011
August 28,
2010
August 29,
2009
Net sales ....................................... $10,391,457 $9,331,005 $8,547,835 $7,866,971 $7,400,606
Cost of sales(1) ................................... 6,836,712 6,071,058 5,515,540 5,058,971 4,822,401
Gross profit ..................................... 3,554,745 3,259,947 3,032,295 2,808,000 2,578,205
Selling, general and administrative expenses ........... 2,866,788 2,584,234 2,409,522 2,234,347 2,122,925
Litigation charge(2) ............................... — 11,500 — — —
Operating profit .................................. 687,957 664,213 622,773 573,653 455,280
Income before income taxes ........................ 690,697 663,938 617,158 563,858 450,925
Income taxes .................................... 247,122 241,698 228,713 205,723 159,659
Net income ..................................... $ 443,575 422,240 388,445 358,135 291,266
Diluted net income per common share ................ $ 3.83 $ 3.58 $ 3.12 $ 2.62 $ 2.07
Dividends declared per common share ................ $ 0.94 $ 0.60 $ 0.695 $ 0.60 $ 0.53
Cash dividends paid per common share ............... $ 0.94 $ 0.78 $ 0.67 $ 0.58 $ 0.52
Cash dividends paid .............................. $ 108,334 $ 91,390 $ 83,439 $ 78,913 $ 72,738
Comparable store sales growth(3) .................... 3.0% 4.7% 5.5% 4.8% 4.0%
Ending selling square feet .......................... 56,846 53,207 49,996 48,225 47,120
Net sales per square foot(4) ......................... $ 189 $ 181 $ 174 $ 165 $ 158
Consumables sales ................................ 72.4% 69.0% 66.5% 65.1% 64.4%
Home products sales .............................. 10.1% 11.4% 12.7% 13.2% 13.4%
Apparel and accessories sales ....................... 7.6% 8.8% 10.0% 10.7% 11.2%
Seasonal and electronics sales ....................... 9.9% 10.8% 10.8% 11.0% 11.0%
Net cash provided by (used in):
Operating activities $ 471,973 $ 369,371 $ 528,064 $ 591,539 $ 529,199
Investing activities ............................ (314,591) (198,311) (280,418) (306,948) (109,355)
Financing activities ........................... (108,716) (220,132) (488,995) (340,727) (139,456)
Total capital expenditures .......................... (744,428) (603,313) (345,268) (212,435) (155,401)
Total proceeds from sale-leaseback .................. 345,249 359,663 — — —
Total repurchases of common stock .................. (74,954) (191,573) (670,466) (332,189) (71,067)
Total assets ..................................... 3,709,861 3,373,065 2,996,205 2,968,145 2,864,112
Working capital .................................. 776,783 702,513 516,789 641,527 718,509
Long-term investment securities ..................... 22,977 23,720 107,458 147,108 163,545
Long-term debt .................................. 516,475 532,520 548,570 250,000 250,000
Shareholders’ equity .............................. $ 1,599,055 $1,297,627 $1,087,074 $1,421,554 $1,440,060
Stores opened ................................... 500 475 300 200 180
Stores closed .................................... 26 56 62 70 96
Number of stores—end of year ...................... 7,916 7,442 7,023 6,785 6,655
*Fiscal 2013 contains 53 weeks. All other fiscal years presented include 52 weeks.
(1) Included in Cost of sales for fiscal 2013 was a one-time $5.0 million favorable accounting adjustment related
to certain vendor allowances.
(2) Fiscal 2012 includes the impact of a litigation charge of $11.5 million (approximately $0.06 per diluted share)
recorded in the fourth quarter of fiscal 2012.
(3) Comparable store sales growth describes the change in net sales in any period for stores that are considered
comparable to the prior period. Comparable store sales include net sales at stores that have been open more
than 13 months. A store becomes comparable the first calendar week it has sales after 13 months of being
opened. Stores that have been renovated, relocated, or expanded are included in the comparable store sales
calculation to the extent they had sales during comparable weeks in each year.
(4) Net sales per square foot was calculated based on total sales for the preceding 12 months as of the ending date
of the reporting period divided by the average selling square footage during the period, including the end of the
fiscal year, the beginning of the fiscal year, and the end of each of our three interim fiscal quarters. Comparable
store sales represent the change in sales attributable to stores open in both the current and prior period, whereas
sales per square foot represents total net sales divided by the average total selling square footage. As a result,
all stores are included in the sales per square foot calculation, including stores without a full year of sales.
23