Family Dollar 2013 Annual Report Download - page 57
Download and view the complete annual report
Please find page 57 of the 2013 Family Dollar annual report below. You can navigate through the pages in the report by either clicking on the pages listed below, or by using the keyword search tool below to find specific information within the annual report.-
 1
1 -
2
-
3
-
4
-
5
-
6
-
7
-
8
-
9
-
10
-
11
-
12
-
13
-
14
-
15
-
16
-
17
-
18
-
19
-
20
-
21
-
22
-
23
-
24
-
25
-
26
-
27
-
28
-
29
-
30
-
31
-
32
-
33
-
34
-
35
-
36
-
37
-
38
-
39
-
40
-
41
-
42
-
43
-
44
-
45
-
46
-
 47
47 -
 48
48 -
 49
49 -
 50
50 -
 51
51 -
 52
52 -
 53
53 -
 54
54 -
 55
55 -
 56
56 -
 57
57 -
 58
58 -
 59
59 -
 60
60 -
 61
61 -
 62
62 -
 63
63 -
 64
64 -
 65
65 -
 66
66 -
 67
67 -
68
-
69
-
70
-
71
-
72
-
73
-
74
-
75
-
76
-
77
-
78
-
79
-
80
-
81
-
82
-
83
-
84
-
85
-
86
-
87
-
88
 |
 |

As discussed in Note 2 above, substantially all of the Company’s auction rate securities are not currently liquid
and have contractual maturities ranging from 24 years to 28 years. The Company’s other debt securities include
primarily municipal bonds and have weighted average maturities of less than one year.
Proceeds from sales of investment securities available-for-sale during fiscal 2013 were $45.7 million compared
to $334.9 million in fiscal 2012 and $415.9 million in fiscal 2011. No material gains or losses were realized on
those sales for fiscal 2013 and no gains or losses were realized on those sales for fiscal 2012 and fiscal 2011.
The Company also holds investments in mutual funds in connection with a deferred compensation plan for
certain key management employees. These investments are classified as trading securities and are included, at
fair value, in other assets on the Consolidated Balance Sheets. The Company records an offsetting deferred
compensation liability in Other Liabilities. The fair value of the deferred compensation plan assets was
$20.0 million as of the end of fiscal 2013 and $17.9 million as of the end of fiscal 2012. See Note 11 below for
more information on the deferred compensation plan.
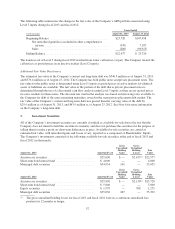
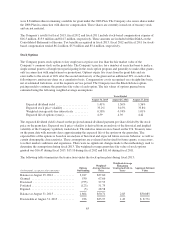
4. Prepayments and Other Current Assets:
Prepayments and Other Current Assets consisted of the following at the end of fiscal 2013 and fiscal 2012:
(in thousands) August 31, 2013 August 25, 2012
Vendor accounts receivable (net) .................... $ 70,579 $14,949
Prepaid rent ..................................... 45,684 —
Other(1) ......................................... 45,289 32,655
$161,552 $47,604
(1) Other current assets consist primarily of accrued interest receivable, short-term insurance assets, non-vendor
receivables, and other prepaid expenses.
The Company performed an evaluation over an allowance for doubtful accounts on all accounts receivable
balances and concluded the balances are not material to the financial statements in fiscal 2013, fiscal 2012 or
fiscal 2011. The increase in the accounts receivable balance is due primarily to the Company’s newly formed
relationship with McLane in fiscal 2013.
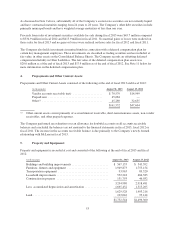
5. Property and Equipment:
Property and equipment is recorded at cost and consisted of the following at the end of fiscal 2013 and fiscal
2012:
(in thousands) August 31, 2013 August 25, 2012
Buildings and building improvements ......................... $ 567,133 $ 543,392
Furniture, fixtures and equipment ............................ 1,949,873 1,755,154
Transportation equipment .................................. 93,963 89,520
Leasehold improvements ................................... 552,218 484,383
Construction in progress ................................... 131,793 46,032
3,294,980 2,918,481
Less: accumulated depreciation and amortization ................ 1,665,452 1,515,265
1,629,528 1,403,216
Land ................................................... 103,016 93,144
$1,732,544 $1,496,360
53