Family Dollar 2013 Annual Report Download - page 54
Download and view the complete annual report
Please find page 54 of the 2013 Family Dollar annual report below. You can navigate through the pages in the report by either clicking on the pages listed below, or by using the keyword search tool below to find specific information within the annual report.-
 1
1 -
2
-
3
-
4
-
5
-
6
-
7
-
8
-
9
-
10
-
11
-
12
-
13
-
14
-
15
-
16
-
17
-
18
-
19
-
20
-
21
-
22
-
23
-
24
-
25
-
26
-
27
-
28
-
29
-
30
-
31
-
32
-
33
-
34
-
35
-
36
-
37
-
38
-
39
-
40
-
41
-
42
-
43
-
 44
44 -
 45
45 -
 46
46 -
 47
47 -
 48
48 -
 49
49 -
 50
50 -
 51
51 -
 52
52 -
 53
53 -
 54
54 -
 55
55 -
 56
56 -
 57
57 -
 58
58 -
 59
59 -
 60
60 -
 61
61 -
 62
62 -
 63
63 -
 64
64 -
65
-
66
-
67
-
68
-
69
-
70
-
71
-
72
-
73
-
74
-
75
-
76
-
77
-
78
-
79
-
80
-
81
-
82
-
83
-
84
-
85
-
86
-
87
-
88
 |
 |

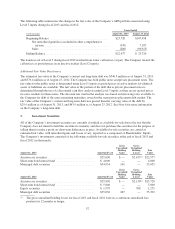
other than quoted prices that are observable for the asset or liability, or inputs that are derived
principally from or corroborated by observable market data by correlation or other means.
• Level 3—Inputs that are unobservable for the asset or liability.
The unobservable inputs in Level 3 can only be used to measure fair value to the extent that observable inputs in
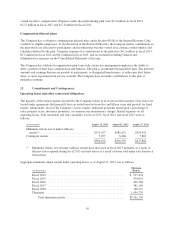
Level 1 and Level 2 are not available. The following table represents the Company’s fair value hierarchy as of
August 31, 2013, and August 25, 2012, for items that are required to be measured at fair value on a recurring
basis:
August 31, 2013
(in thousands) Fair Value Level 1 Level 2 Level 3
Cash equivalents:
Money market funds ....................... $26,200 $26,200 $ — $ —
Investment securities:
Auction rate securities ...................... $22,977 — — 22,977
Short-term bond mutual fund ................ $ 4,000 4,000 — —
Restricted cash and investments:(1)
Money market funds ....................... $ 437 437 — —
Municipal debt securities .................... $55,055 — 55,055 —
Other assets:
Mutual funds(2) ............................ $20,043 20,043 — —
August 25, 2012
(in thousands) Fair Value Level 1 Level 2 Level 3
Cash equivalents:
Money market funds ....................... $18,902 $18,902 $ — $ —
Investment securities:
Auction rate securities ...................... $23,720 — — 23,720
Short-term bond mutual fund ................ $ 5,000 5,000 — —
Equity securities .......................... $ 1,271 1,271 — —
Restricted cash and investments:(1)
Municipal debt securities .................... $55,303 — 55,303 —
Other assets:
Mutual funds(2) ............................ $17,903 17,903 — —
(1) As of August 31, 2013, restricted cash and investments of $35.4 million and $20.1 million were
included in Restricted Cash and Investments and Other Assets, respectively, in the Consolidated
Balance Sheets. As of August 25, 2012, restricted cash and investments of $45.9 million and
$9.4 million were included in Restricted Cash and Investments and Other Assets, respectively, in the
Consolidated Balance Sheets. See Note 1 for more information.
(2) Represents assets held pursuant to a deferred compensation plan for certain key management
employees.
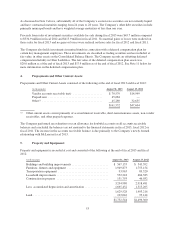
On a non-recurring basis, the Company adjusts certain Property and Equipment to fair value through impairment
charges. Property and Equipment is reviewed for impairment whenever events or changes in circumstances
indicate that the carrying amount of an asset or asset group may not be recoverable. The fair value of the
Property and Equipment is determined based on a discounted cash flow analysis using Level 3 inputs. The
Company estimates future cash flows based on historical experience and its expectations of future performance.
Impairment charges were not material during fiscal 2013, fiscal 2012 or fiscal 2011.
50