Family Dollar 2013 Annual Report Download - page 28
Download and view the complete annual report
Please find page 28 of the 2013 Family Dollar annual report below. You can navigate through the pages in the report by either clicking on the pages listed below, or by using the keyword search tool below to find specific information within the annual report.-
 1
1 -
2
-
3
-
4
-
5
-
6
-
7
-
8
-
9
-
10
-
11
-
12
-
13
-
14
-
15
-
16
-
17
-
 18
18 -
 19
19 -
 20
20 -
 21
21 -
 22
22 -
 23
23 -
 24
24 -
 25
25 -
 26
26 -
 27
27 -
 28
28 -
 29
29 -
 30
30 -
 31
31 -
 32
32 -
 33
33 -
 34
34 -
 35
35 -
 36
36 -
 37
37 -
 38
38 -
39
-
40
-
41
-
42
-
43
-
44
-
45
-
46
-
47
-
48
-
49
-
50
-
51
-
52
-
53
-
54
-
55
-
56
-
57
-
58
-
59
-
60
-
61
-
62
-
63
-
64
-
65
-
66
-
67
-
68
-
69
-
70
-
71
-
72
-
73
-
74
-
75
-
76
-
77
-
78
-
79
-
80
-
81
-
82
-
83
-
84
-
85
-
86
-
87
-
88
 |
 |

ITEM 7. MANAGEMENT’S DISCUSSION AND ANALYSIS OF FINANCIAL CONDITION
AND RESULTS OF OPERATIONS
The following discussion summarizes the significant factors affecting our consolidated results of operations
and financial condition for fiscal 2013, fiscal 2012, and fiscal 2011, and our expectations for fiscal 2014. You
should read this discussion in conjunction with our Consolidated Financial Statements and the Notes to
Consolidated Financial Statements, which are included in this Report. Our discussion contains forward-looking
statements which are based upon our current expectations and which involve risks and uncertainties. Actual
results and the timing of events could differ materially from those anticipated in these forward-looking
statements as a result of a number of factors, including those set forth in the “Cautionary Statement Regarding
Forward-Looking Statements” in the General Information section of this Report and the “Risk Factors” listed in
Part I—Item 1A of this Report.
Our fiscal year generally ends on the Saturday closest to August 31 of each year, which generally results in
an extra week every six years. Fiscal 2013 was a 53-week year. Fiscal 2012 and fiscal 2011 were 52-week years.
Fiscal 2014 will be a 52-week year.
Executive Overview
We operate a chain of more than 7,900 general merchandise retail discount stores in 46 states, providing
consumers with a selection of competitively priced merchandise in convenient neighborhood stores. Our
merchandise assortment includes Consumables, Home Products, Apparel and Accessories, and Seasonal and
Electronics. We classify the combination of Home Products, Apparel and Accessories, and Seasonal and
Electronics as “Discretionary.” We sell merchandise at prices that generally range from less than $1 to $10.
The current macro-economic environment continues to impact our financial results. During fiscal 2013, our
customers continued to face increased financial pressures, including continued high unemployment rates,
increased payroll taxes and volatility in gasoline prices. In fiscal 2013, customers focused their spending on
necessities, with sales in Consumables increasing 16.9% and sales in Discretionary categories decreasing 0.9% as
compared to fiscal 2012. This trend continues to pressure our profitability. However, our investments to increase
our relevancy to customers have resulted in market share gains.
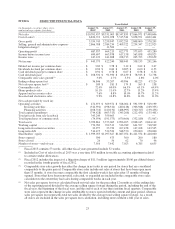
During fiscal 2013, as compared with fiscal 2012, our net sales increased 11.4% to $10.4 billion, our net
income increased 5.1% to $443.6 million, and our diluted net income per common share increased 7.0% to $3.83.
Comparable store sales (stores open more than 13 months) for fiscal 2013 increased 3.0% compared with fiscal
2012. Consistent with the National Retail Federation Calendar, fiscal 2013 included 53 weeks as compared to
52 weeks in fiscal 2012. The additional week accounted for approximately $189 million in net sales and
approximately $0.07 per diluted share during fiscal 2013.
During fiscal 2013, we remained focused on achieving our four corporate goals: build customer loyalty and
experience; deliver profitable sales growth; drive continuous improvement; and develop diverse, high performing
teams.
• We achieved our new store opening goal and opened 500 stores in fiscal 2013, including our first store
in Montana.
• We renovated, relocated or expanded 830 stores under our comprehensive store renovation program,
which is intended to increase our competitiveness and sales productivity by transforming our
customer’s shopping experience. In fiscal 2013, we enhanced this program based on learnings and
customer feedback.
• We opened our eleventh distribution center in St. George, Utah, which reduced the average stem miles
between our distribution centers and our stores by approximately 7% at the end fiscal 2013, as
compared to the end of fiscal 2012.
24