Family Dollar 2013 Annual Report Download - page 33
Download and view the complete annual report
Please find page 33 of the 2013 Family Dollar annual report below. You can navigate through the pages in the report by either clicking on the pages listed below, or by using the keyword search tool below to find specific information within the annual report.-
 1
1 -
2
-
3
-
4
-
5
-
6
-
7
-
8
-
9
-
10
-
11
-
12
-
13
-
14
-
15
-
16
-
17
-
18
-
19
-
20
-
21
-
22
-
 23
23 -
 24
24 -
 25
25 -
 26
26 -
 27
27 -
 28
28 -
 29
29 -
 30
30 -
 31
31 -
 32
32 -
 33
33 -
 34
34 -
 35
35 -
 36
36 -
 37
37 -
 38
38 -
 39
39 -
 40
40 -
 41
41 -
 42
42 -
 43
43 -
44
-
45
-
46
-
47
-
48
-
49
-
50
-
51
-
52
-
53
-
54
-
55
-
56
-
57
-
58
-
59
-
60
-
61
-
62
-
63
-
64
-
65
-
66
-
67
-
68
-
69
-
70
-
71
-
72
-
73
-
74
-
75
-
76
-
77
-
78
-
79
-
80
-
81
-
82
-
83
-
84
-
85
-
86
-
87
-
88
 |
 |
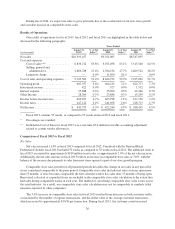
insurance expense (approximately 0.2% of net sales). These improvements were partially offset by increased
marketing expense (approximately 0.1% of net sales) in fiscal 2012, as compared to fiscal 2011. The decrease in
store payroll costs was a result of the continued benefit from improvements implemented to re-engineer many of
our core store processes, which has increased workforce productivity. Insurance expense continues to benefit
from favorable trends in workers’ compensation and general liability costs reflecting improvements we have
made in our store operations and risk management processes. Our marketing expense increased as a percentage
of net sales as we expanded our customer communications, leveraged various marketing vehicles and improved
our marketing and promotional materials.
Litigation Charge
During the fourth quarter of fiscal 2012, we recorded an $11.5 million litigation charge associated with the
preliminary settlement of a lawsuit in the state of New York. This lawsuit involves claims for overtime pay from
New York store managers who worked in our stores.
Investment Income
The change in investment income in fiscal 2012, as compared to fiscal 2011, was not material.
Interest Expense
Interest expense increased $2.6 million in fiscal 2012 compared to fiscal 2011. On January 28, 2011, we
issued $300 million in senior unsecured notes with a coupon rate of 5.00% maturing in 2021 (the “2021 Notes”).
The increase in interest expense in fiscal 2012, as compared to fiscal 2011, was primarily driven by the interest
expense on the 2021 Notes.
Other Income
The change in other income in fiscal 2012, as compared to fiscal 2011, was not material.
Income Taxes
The effective tax rate was 36.4% for fiscal 2012 compared to 37.1% in fiscal 2011. The decrease in the
effective tax rate in fiscal 2012, as compared to fiscal 2011, was due primarily to foreign tax benefits realized in
connection with the Company’s Global Sourcing efforts and a decrease in the reserves for uncertain tax positions.
Liquidity and Capital Resources
General
We have consistently maintained a strong liquidity position. During fiscal 2013, our cash and cash
equivalents increased $48.7 million, as compared to fiscal 2012, and our operating cash flows were
$472.0 million. We believe our operating cash flows, proceeds from sale-leaseback transactions, and credit
facilities are sufficient to fund our regular operating needs, capital expenditure program, share repurchases, cash
dividend payments, and principal and interest payments. We have availability under our two credit facilities to
borrow up to $700 million (less standby letters of credit needed for collateral for our insurance programs of $18.8
million) to supplement operating cash flows. During fiscal 2013, to help supplement our operating cash flows
and to support our growth initiatives, including our significant merchandise expansions and our Fee Development
Program, we had borrowings under our unsecured revolving credit facilities and had an average daily outstanding
balance of $141.5 million during fiscal 2013. Working capital at the end of fiscal 2013 was $776.8 million
compared to $702.5 million at the end of fiscal 2012. We believe operating cash flows and capacity under
existing credit facilities will continue to provide sufficient liquidity for our ongoing operations and growth
initiatives.
29