Family Dollar 2013 Annual Report Download - page 26
Download and view the complete annual report
Please find page 26 of the 2013 Family Dollar annual report below. You can navigate through the pages in the report by either clicking on the pages listed below, or by using the keyword search tool below to find specific information within the annual report.
See Note 14 to the Consolidated Financial Statements included in this Report for more information
regarding share repurchases.
Equity Compensation Plan Information
This information will be included in our proxy statement to be filed for the Annual Meeting of Stockholders
to be held in January 2014, under the caption “Equity Compensation Plan Information” and is incorporated
herein by reference.
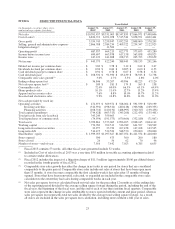
Stock Performance Graph
The following graph sets forth the yearly percentage change in the cumulative total shareholder return on
our common stock during the five fiscal years ended August 31, 2013, compared with the cumulative total
returns of the S&P 500 Index and the S&P General Merchandise Stores Index. The comparison assumes that
$100 was invested in Family Dollar common stock on September 1, 2008, and in each of the foregoing indices on
August 31, 2008, and that dividends were reinvested.
COMPARISON OF 5 YEAR CUMULATIVE TOTAL RETURN
Among Family Dollar Stores, Inc., the S&P 500 Index
and the S&P General Merchandise Stores Index
$50
$100
$150
$250
$200
$350
$300
8/30/08 8/29/09 8/28/10 8/27/11 8/25/12 8/31/13
Family Dollar Stores, Inc. S&P 500 S&P General Merchandise Stores
309
146
142
125
180
267
139
120
113
201
102
106
86
93
82
22


