Family Dollar 2013 Annual Report Download - page 31
Download and view the complete annual report
Please find page 31 of the 2013 Family Dollar annual report below. You can navigate through the pages in the report by either clicking on the pages listed below, or by using the keyword search tool below to find specific information within the annual report.-
 1
1 -
2
-
3
-
4
-
5
-
6
-
7
-
8
-
9
-
10
-
11
-
12
-
13
-
14
-
15
-
16
-
17
-
18
-
19
-
20
-
 21
21 -
 22
22 -
 23
23 -
 24
24 -
 25
25 -
 26
26 -
 27
27 -
 28
28 -
 29
29 -
 30
30 -
 31
31 -
 32
32 -
 33
33 -
 34
34 -
 35
35 -
 36
36 -
 37
37 -
 38
38 -
 39
39 -
 40
40 -
 41
41 -
42
-
43
-
44
-
45
-
46
-
47
-
48
-
49
-
50
-
51
-
52
-
53
-
54
-
55
-
56
-
57
-
58
-
59
-
60
-
61
-
62
-
63
-
64
-
65
-
66
-
67
-
68
-
69
-
70
-
71
-
72
-
73
-
74
-
75
-
76
-
77
-
78
-
79
-
80
-
81
-
82
-
83
-
84
-
85
-
86
-
87
-
88
 |
 |
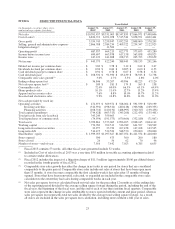
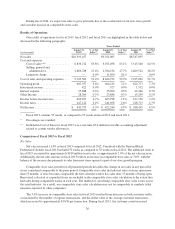
approximately 1.7%, and the average customer transaction increased approximately 1.3% compared to fiscal
2012. Sales during fiscal 2013 were strongest in the Consumables category.
During fiscal 2013, we opened 500 stores and closed 26 stores for a net addition of 474 stores, compared
with the opening of 475 stores and closing of 56 stores for a net addition of 419 stores during fiscal 2012.
Cost of Sales
Cost of sales increased 12.6% in fiscal 2013 compared to fiscal 2012. The increase was primarily due to
additional sales volume. Included in Cost of sales for fiscal 2013 was a one-time $5.0 million favorable
accounting adjustment related to certain vendor allowances. Cost of sales, as a percentage of net sales, was
65.8% in fiscal 2013 compared to 65.1% in fiscal 2012. Cost of sales, as a percentage of net sales, was negatively
impacted by the significant shift in sales mix to lower-margin consumable merchandise, an increase in inventory
shrinkage, and an increase in markdowns. These pressures were partially offset by higher purchase markups on
merchandise sales and lower freight expense.
The growth in sales of lower-margin consumables (72.4% of net sales in fiscal 2013 compared with 69.0%
of net sales in fiscal 2012) as well as the softness in sales of discretionary items continues to pressure cost of
sales as a percentage of net sales. While our inventory levels were lower on a per store basis at the end of fiscal
2013, as compared to fiscal 2012, the average inventory balance in our stores was higher throughout fiscal 2013,
as compared to fiscal 2012. Inventory shrinkage increased during fiscal 2013, as compared to fiscal 2012, due in
part to increased average inventory levels throughout fiscal 2013. We continue to use markdowns in our stores to
drive revenue growth and increase market share in a challenging environment. In addition, we have increased our
markdowns as we continue to refine our assortment of consumable merchandise. We continue to focus on
improving our purchase markups through improved price management, expansion of our Global Sourcing efforts,
and the continued development of our private brand assortment. The decrease in freight expense was a result of
changes in our supply chain as it relates to our newly formed relationship with McLane, which results in less
merchandise processed through our own distribution network.
Selling, General and Administrative Expenses
SG&A expenses increased 10.9% in fiscal 2013 compared to fiscal 2012. The increase in these expenses
was due in part to additional sales volume and additional costs arising from the continued growth in the number
of stores in operation. SG&A expenses, as a percentage of net sales, were 27.6% in fiscal 2013 compared to
27.7% in fiscal 2012. SG&A expenses, as a percentage of net sales, were leveraged as a result of a decrease in
non-store payroll costs, including incentive compensation expense (approximately 0.2% of net sales), partially
offset by increased store occupancy costs (approximately 0.2% of net sales) in fiscal 2013, as compared to fiscal
2012.
Reflecting our pay-for-performance philosophy, incentive compensation costs decreased as a percentage of
net sales as a result of our relative performance against our target in fiscal 2013, as compared to fiscal 2012.
Store occupancy costs increased as a percentage of net sales in fiscal 2013, as compared to fiscal 2012, primarily
driven by the additional rental expense on the 532 stores sold pursuant to sale-leaseback transactions in the
second half of fiscal 2012 and in fiscal 2013.
Litigation Charge
During the fourth quarter of fiscal 2012, we recorded an $11.5 million litigation charge associated with the
settlement of a lawsuit in the state of New York. This lawsuit involves claims for overtime pay from New York
store managers who worked in our stores.
Investment Income
The change in investment income in fiscal 2013, as compared to fiscal 2012, was not material.
27