Family Dollar 2013 Annual Report Download - page 37
Download and view the complete annual report
Please find page 37 of the 2013 Family Dollar annual report below. You can navigate through the pages in the report by either clicking on the pages listed below, or by using the keyword search tool below to find specific information within the annual report.-
 1
1 -
2
-
3
-
4
-
5
-
6
-
7
-
8
-
9
-
10
-
11
-
12
-
13
-
14
-
15
-
16
-
17
-
18
-
19
-
20
-
21
-
22
-
23
-
24
-
25
-
26
-
 27
27 -
 28
28 -
 29
29 -
 30
30 -
 31
31 -
 32
32 -
 33
33 -
 34
34 -
 35
35 -
 36
36 -
 37
37 -
 38
38 -
 39
39 -
 40
40 -
 41
41 -
 42
42 -
 43
43 -
 44
44 -
 45
45 -
 46
46 -
 47
47 -
48
-
49
-
50
-
51
-
52
-
53
-
54
-
55
-
56
-
57
-
58
-
59
-
60
-
61
-
62
-
63
-
64
-
65
-
66
-
67
-
68
-
69
-
70
-
71
-
72
-
73
-
74
-
75
-
76
-
77
-
78
-
79
-
80
-
81
-
82
-
83
-
84
-
85
-
86
-
87
-
88
 |
 |
Additionally, in fiscal 2013, we continued to expand our Global Sourcing team, develop stronger processes
to help us integrate our sourcing activities with our category management efforts and expand our supplier
network. As a result of this global expansion and the increased activities being performed by our Global Sourcing
team members, we had $23.0 million of cash and cash equivalents in these foreign entities as of August 31, 2013.
We are not dependent on dividends from our foreign entities to fund our domestic operations. Unremitted
earnings from foreign entities, which are considered to be invested indefinitely, would become subject to U.S.
income taxes if they were remitted as dividends or were lent to a domestic entity.
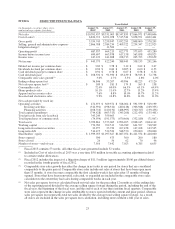
Cash Flows from Operating Activities
Cash provided by operating activities increased $102.6 million during fiscal 2013 to $472.0 million, as
compared to fiscal 2012. The increase was due primarily to a reduction in payments for merchandise inventories
in fiscal 2013, as compared to fiscal 2012, which was offset partially by changes in prepayments and other
current assets and income taxes, all in the ordinary course of business.
Cash provided by operating activities decreased $158.7 million during fiscal 2012, as compared to fiscal
2011. The decrease was due primarily to an increase in merchandise inventories in fiscal 2012 as noted above,
and a decrease in accounts payable and accrued liabilities, which was offset partially by changes in prepayments
and other current assets and higher net income, all in the ordinary course of business.
Cash Flows from Investing Activities
Cash used in investing activities increased $116.3 million during fiscal 2013 to $314.6 million, as compared
to fiscal 2012. The change was due primarily to an increase in capital expenditures, offset partially by net
changes in restricted cash and investments and investment securities. The increase in capital expenditures during
fiscal 2013 is discussed above.
Cash used in investing activities decreased $82.1 million during fiscal 2012, as compared to fiscal 2011. The
change was due to the net proceeds received from the sale-leaseback transaction of $359.7 million, offset
partially by an increase in capital expenditures. The increase in capital expenditures during fiscal 2012 is
discussed above.
Cash Flows from Financing Activities
Cash used in financing activities decreased $111.4 million during fiscal 2013 to $108.7 million, as
compared to fiscal 2012. We purchased $75.0 million of our common stock during fiscal 2013 as compared to
$191.6 million in fiscal 2012, a decrease in share repurchases of $116.6 million.
Cash used in financing activities decreased $268.9 million during fiscal 2012, as compared to fiscal 2011.
We purchased $191.6 million of our common stock during fiscal 2012 as compared to $670.5 million in fiscal
2011, a decrease in share repurchases of $478.9 million. In addition, during fiscal 2011, we issued $300 million
of 5.00% unsecured senior notes, creating a significant cash inflow from financing activities in fiscal 2011,
which offset the decrease in share repurchases.
33