Family Dollar 2013 Annual Report Download - page 30
Download and view the complete annual report
Please find page 30 of the 2013 Family Dollar annual report below. You can navigate through the pages in the report by either clicking on the pages listed below, or by using the keyword search tool below to find specific information within the annual report.-
 1
1 -
2
-
3
-
4
-
5
-
6
-
7
-
8
-
9
-
10
-
11
-
12
-
13
-
14
-
15
-
16
-
17
-
18
-
19
-
 20
20 -
 21
21 -
 22
22 -
 23
23 -
 24
24 -
 25
25 -
 26
26 -
 27
27 -
 28
28 -
 29
29 -
 30
30 -
 31
31 -
 32
32 -
 33
33 -
 34
34 -
 35
35 -
 36
36 -
 37
37 -
 38
38 -
 39
39 -
 40
40 -
41
-
42
-
43
-
44
-
45
-
46
-
47
-
48
-
49
-
50
-
51
-
52
-
53
-
54
-
55
-
56
-
57
-
58
-
59
-
60
-
61
-
62
-
63
-
64
-
65
-
66
-
67
-
68
-
69
-
70
-
71
-
72
-
73
-
74
-
75
-
76
-
77
-
78
-
79
-
80
-
81
-
82
-
83
-
84
-
85
-
86
-
87
-
88
 |
 |

During fiscal 2014, we expect net sales to grow primarily due to the acceleration of our new store growth
and a modest increase in comparable stores sales.
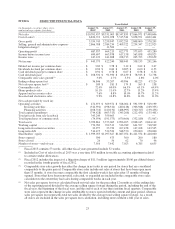
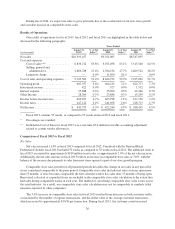
Results of Operations
Our results of operations for fiscal 2013, fiscal 2012 and fiscal 2011 are highlighted in the table below and
discussed in the following paragraphs:
Years Ended
(in thousands)
August 31,
2013*
% of Net
Sales**
August 25,
2012
% of Net
Sales**
August 27,
2011
% of Net
Sales**
Net sales ......................... $10,391,457 $9,331,005 $8,547,835
Cost and expenses:
Cost of sales*** ............... 6,836,712 65.8% 6,071,058 65.1% 5,515,540 64.5%
Selling, general and
administrative ............... 2,866,788 27.6% 2,584,234 27.7% 2,409,522 28.2%
Litigation charge ............... — 0.0% 11,500 0.1% — 0.0%
Cost of sales and operating expenses . . . 9,703,500 93.4% 8,666,792 92.9% 7,925,062 92.7%
Operating profit ................... 687,957 6.6% 664,213 7.1% 622,773 7.3%
Investment income ................. 422 0.0% 927 0.0% 1,532 0.0%
Interest expense ................... 25,888 0.2% 25,090 0.3% 22,446 0.3%
Other Income ..................... 28,206 0.3% 23,888 0.3% 15,299 0.2%
Income before income taxes .......... 690,697 6.7% 663,938 7.1% 617,158 7.2%
Income taxes ...................... 247,122 2.4% 241,698 2.6% 228,713 2.7%
Net Income ....................... $ 443,575 4.3% $ 422,240 4.5% $ 388,445 4.5%
*Fiscal 2013 contains 53 weeks, as compared to 52 weeks in fiscal 2012 and fiscal 2011.
** Percentages are rounded.
*** Included in Cost of Sales for fiscal 2013 was a one-time $5.0 million favorable accounting adjustment
related to certain vendor allowances.
Comparison of Fiscal 2013 to Fiscal 2012
Net Sales
Net sales increased 11.4% in fiscal 2013 compared to fiscal 2012. Consistent with the National Retail
Federation Calendar, fiscal 2013 included 53 weeks as compared to 52 weeks in fiscal 2012. The additional week in
fiscal 2013 accounted for approximately $189 million in net sales, or approximately 2.0% of the net sales increase.
Additionally, the net sales increase in fiscal 2013 reflects an increase in comparable store sales of 3.0%, with the
balance of the increase due primarily to sales from new stores opened as part of our store growth program.
Comparable store sales growth for all presented periods describes the change in net sales in any period for
stores considered comparable to the prior period. Comparable store sales includes net sales at stores open more
than 13 months. A store becomes comparable the first calendar week it has sales after 13 months of being open.
Renovated, relocated or expanded stores are included in the comparable store sales calculation to the extent they
had sales during comparable weeks in each year. The method of calculating comparable store sales varies across
the retail industry. As a result, our comparable store sales calculation may not be comparable to similarly titled
measures reported by other companies.
The 3.0% increase in comparable store sales in fiscal 2013 resulted from increases in both customer traffic,
as measured by the number of register transactions, and the dollar value of the average customer transaction,
which increased to approximately $10.50 per transaction. During fiscal 2013, the customer count increased
26