Dish Network 2007 Annual Report Download - page 74
Download and view the complete annual report
Please find page 74 of the 2007 Dish Network annual report below. You can navigate through the pages in the report by either clicking on the pages listed below, or by using the keyword search tool below to find specific information within the annual report.-
 1
1 -
2
-
3
-
4
-
5
-
6
-
7
-
8
-
9
-
10
-
11
-
12
-
13
-
14
-
15
-
16
-
17
-
18
-
19
-
20
-
21
-
22
-
23
-
24
-
25
-
26
-
27
-
28
-
29
-
30
-
31
-
32
-
33
-
34
-
35
-
36
-
37
-
38
-
39
-
40
-
41
-
42
-
43
-
44
-
45
-
46
-
47
-
48
-
49
-
50
-
51
-
52
-
53
-
54
-
55
-
56
-
57
-
58
-
59
-
60
-
61
-
62
-
63
-
 64
64 -
 65
65 -
 66
66 -
 67
67 -
 68
68 -
 69
69 -
 70
70 -
 71
71 -
 72
72 -
 73
73 -
 74
74 -
 75
75 -
 76
76 -
 77
77 -
 78
78 -
 79
79 -
 80
80 -
 81
81 -
 82
82 -
 83
83 -
 84
84 -
85
-
86
-
87
-
88
-
89
-
90
-
91
-
92
-
93
-
94
-
95
-
96
-
97
-
98
-
99
-
100
-
101
-
102
-
103
-
104
-
105
-
106
-
107
-
108
-
109
-
110
-
111
-
112
-
113
-
114
-
115
-
116
-
117
-
118
-
119
-
120
-
121
-
122
-
123
-
124
-
125
-
126
-
127
-
128
-
129
-
130
-
131
-
132
-
133
-
134
-
135
-
136
-
137
-
138
-
139
-
140
-
141
-
142
-
143
-
144
-
145
-
146
-
147
-
148
-
149
-
150
-
151
 |
 |

Table of Contents
We also have several strategic investments in certain non-marketable equity securities which are included in “Other noncurrent assets, net” on
our Consolidated Balance Sheets. Generally, we account for our unconsolidated equity investments under either the equity method or cost
method of accounting. Because these equity securities are not publicly traded, it is not practical to regularly estimate the fair value of the
investments; however, these investments are subject to an evaluation for other than temporary impairment on a quarterly basis. This quarterly
evaluation consists of reviewing, among other things, company business plans and current financial statements, if available, for factors that
may indicate an impairment of our investment. Such factors may include, but are not limited to, cash flow concerns, material litigation,
violations of debt covenants and changes in business strategy. The fair value of these equity investments is not estimated unless there are
identified changes in circumstances that may indicate an impairment exists and these changes are likely to have a significant adverse effect on
the fair value of the investment. As of December 31, 2006, we had $188.6 million aggregate carrying amount of non-marketable and
unconsolidated strategic equity investments, of which $97.8 million is accounted for under the cost method. During the year ended
December 31, 2006, we recorded $18.0 million of impairment charges with respect to these investments.
We also have a strategic investment in non-public preferred stock, public common stock and convertible debt of a foreign public company
which is included in “Other noncurrent assets, net” on our Consolidated Balance Sheets. The debt is convertible into the issuer’s publicly
traded common shares. We account for the convertible debt at fair value with changes in fair value reported each period as unrealized gains or
losses in “Other” income or expense in our Consolidated Statements of Operations and Comprehensive Income (Loss). We estimate the fair
value of the convertible debt using certain assumptions and judgments in applying a discounted cash flow analysis and the Black-Scholes
option pricing model. As of December 31, 2006, the fair value of the convertible debt was approximately $22.5 million based on the trading
price of the issuer’s shares on that date. During the second quarter of 2006, we converted a portion of the convertible debt to public common
shares and determined that we have the ability to significantly influence the operating decisions of the issuer. Consequently, we account for the
common share component of our investment under the equity method of accounting. Additionally, during the year ended December 31, 2006,
we recognized a pre-tax unrealized loss of approximately $14.9 million for the change in the fair value of the convertible debt. As of
December 31, 2006, we have $59.1 million recorded as part of the total equity investment in “Other non-current assets, net” for the amount by
which the carrying value of our investment in the issuer’s common stock exceeds the value of our portion of the underlying balance sheet
equity of the investee. As a result of our change from cost to equity method accounting, we evaluate the common share component on a
quarterly basis to determine whether declines in the fair value of this security are other than temporary. This quarterly evaluation is similar to
that used for marketable securities, as discussed above.
Our ability to realize value from our strategic investments in companies that are not publicly traded is dependent on the success of their
business and their ability to obtain sufficient capital to execute their business plans. Because private markets are not as liquid as public markets,
there is also increased risk that we will not be able to sell these investments, or that when we desire to sell them we will not be able to obtain
fair value for them.
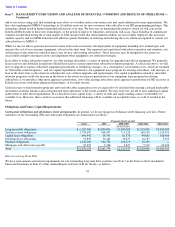
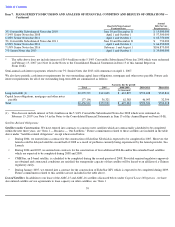
As of December 31, 2006, we had $6.562 billion of fixed-rate debt, mortgages and other notes payable that we estimated the fair value to be
approximately $6.499 billion using quoted market prices where available. In completing our analysis for our private debt, we evaluate market
conditions, related securities, various public and private offerings, and other publicly available information. In performing this analysis, we
make various assumptions regarding credit spreads, volatility, and the impact of these factors on the value of the notes. The fair value of our
fixed-rate debt and mortgages is affected by fluctuations in interest rates. A hypothetical 10.0% decrease in assumed interest rates would
increase the fair value of our debt by approximately $186.8 million. To the extent interest rates increase, our costs of financing would increase
at such time as we are required to refinance our debt. As of December 31, 2006, a hypothetical 10.0% increase in assumed interest rates would
increase our annual interest expense by approximately $40.5 million.
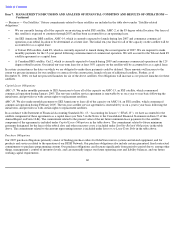
In general, we do not use derivative financial instruments for hedging or speculative purposes, but we may do so in the future.
Our Consolidated Financial Statements are included in this report beginning on page F-1.
Not applicable.
Under the supervision and with the participation of our management, including our Chief Executive Officer and Chief Financial Officer, we
evaluated the effectiveness of our disclosure controls and procedures (as defined in Rule
66
Item 8.
FINANCIAL STATEMENTS AND SUPPLEMENTARY DATA
Item 9.
CHANGES IN AND DISAGREEMENTS WITH ACCOUNTANTS ON ACCOUNTING AND FINANCIAL DISCLOSURE
Item 9A.
CONTROLS AND PROCEDURES