Dish Network 2007 Annual Report Download - page 63
Download and view the complete annual report
Please find page 63 of the 2007 Dish Network annual report below. You can navigate through the pages in the report by either clicking on the pages listed below, or by using the keyword search tool below to find specific information within the annual report.-
 1
1 -
2
-
3
-
4
-
5
-
6
-
7
-
8
-
9
-
10
-
11
-
12
-
13
-
14
-
15
-
16
-
17
-
18
-
19
-
20
-
21
-
22
-
23
-
24
-
25
-
26
-
27
-
28
-
29
-
30
-
31
-
32
-
33
-
34
-
35
-
36
-
37
-
38
-
39
-
40
-
41
-
42
-
43
-
44
-
45
-
46
-
47
-
48
-
49
-
50
-
51
-
52
-
 53
53 -
 54
54 -
 55
55 -
 56
56 -
 57
57 -
 58
58 -
 59
59 -
 60
60 -
 61
61 -
 62
62 -
 63
63 -
 64
64 -
 65
65 -
 66
66 -
 67
67 -
 68
68 -
 69
69 -
 70
70 -
 71
71 -
 72
72 -
 73
73 -
74
-
75
-
76
-
77
-
78
-
79
-
80
-
81
-
82
-
83
-
84
-
85
-
86
-
87
-
88
-
89
-
90
-
91
-
92
-
93
-
94
-
95
-
96
-
97
-
98
-
99
-
100
-
101
-
102
-
103
-
104
-
105
-
106
-
107
-
108
-
109
-
110
-
111
-
112
-
113
-
114
-
115
-
116
-
117
-
118
-
119
-
120
-
121
-
122
-
123
-
124
-
125
-
126
-
127
-
128
-
129
-
130
-
131
-
132
-
133
-
134
-
135
-
136
-
137
-
138
-
139
-
140
-
141
-
142
-
143
-
144
-
145
-
146
-
147
-
148
-
149
-
150
-
151
 |
 |

Table of Contents
restricted and unrestricted cash, cash equivalents and marketable investment securities totaled $3.206 billion, including $172.9 million of
restricted cash and marketable investment securities, compared to $1.248 billion, including $67.1 million of restricted cash and marketable
investment securities, as of December 31, 2005.
The following discussion highlights our free cash flow and cash flow activities during the years ended December 31, 2006, 2005 and 2004.
Free cash flow. We define free cash flow as “Net cash flows from operating activities” less “Purchases of property and equipment,” as shown
on our Consolidated Statements of Cash Flows. We believe free cash flow is an important liquidity metric because it measures, during a given
period, the amount of cash generated that is available to repay debt obligations, make investments, fund acquisitions and for certain other
activities. Free cash flow is not a measure determined in accordance with GAAP and should not be considered a substitute for “Operating
income,” “Net income,” “Net cash flows from operating activities”
or any other measure determined in accordance with GAAP. Since free cash
flow includes investments in operating assets, we believe this non-GAAP liquidity measure is useful in addition to the most directly
comparable GAAP measure — “Net cash flows from operating activities.”
During the years ended December 31, 2006, 2005 and 2004, free cash flow was significantly impacted by changes in operating assets and
liabilities as shown in the “Net cash flows from operating activities” section of our Consolidated Statements of Cash Flows included herein.
Operating asset and liability balances can fluctuate significantly from period to period and there can be no assurance that free cash flow will not
be negatively impacted by material changes in operating assets and liabilities in future periods, since these changes depend upon, among other
things, management’s timing of payments and control of inventory levels, and cash receipts. In addition to fluctuations resulting from changes
in operating assets and liabilities, free cash flow can vary significantly from period to period depending upon, among other things, subscriber
growth, subscriber revenue, subscriber churn, subscriber acquisition costs including amounts capitalized under our equipment lease programs,
operating efficiencies, increases or decreases in purchases of property and equipment and other factors.
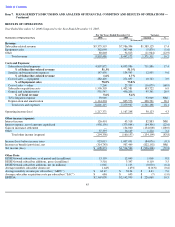
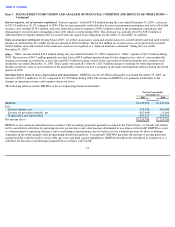
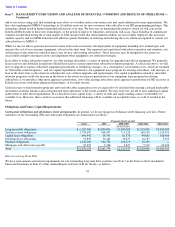
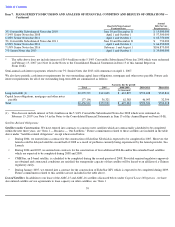
The following table reconciles free cash flow to “Net cash flows from operating activities.”
Free cash flow was $882.9 million, $267.7 million and $20.9 million for the years ended December 31, 2006, 2005 and 2004, respectively.
The improvement in free cash flow from 2005 to 2006 of $615.2 million resulted from an increase in “Net cash flows from operating activities”
of $505.1 million, or 28.5%, and a decrease in “Purchases of property and equipment” of $110.1 million, or 7.3%. The increase in “Net cash
flows from operating activities” was primarily attributable to a $328.4 million increase in net income, net of changes in: (i) “Deferred tax
expense (benefit);” (ii) “Gain on insurance settlement;” and (iii) “Depreciation and amortization” expense. A $168.4 million increase in cash
resulting from changes in operating assets and liabilities also contributed to the increase. The 2006 decrease in “Purchases of property and
equipment” was primarily attributable to a decline in overall capital expenditures, including satellite construction, and equipment under our
new subscriber lease program, partially offset by increased spending for equipment under our existing subscriber lease program.
The improvement in free cash flow from 2004 to 2005 of $246.8 million resulted from an increase in “Net cash flows from operating activities”
of $772.6 million, or 77.2%, partially offset by an increase in “Purchases of property and equipment”
of $525.8 million, or 53.6%. The increase
in “Net cash flows from operating activities” was primarily attributable to an $864.2 million increase in net income, net of changes in:
(i) “Deferred tax expense (benefit);” (ii) “Gain on insurance settlement;” (iii) “Realized and unrealized losses (gains) on investments;” and
(iv) “Depreciation and amortization” expense, partially offset by a $77.7 million decrease in cash resulting from changes in operating assets
and liabilities. The increase in “Purchases of property and equipment”
was primarily attributable to increased spending for equipment under our
new and existing lease programs, and satellite construction, partially offset by a decline in overall corporate capital expenditures.
55
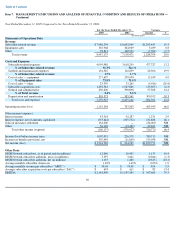
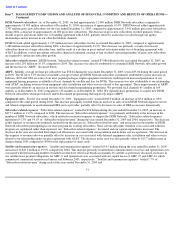
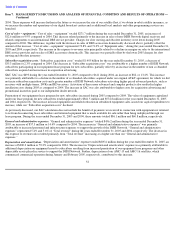
Item 7.
MANAGEMENT’S DISCUSSION AND ANALYSIS OF FINANCIAL CONDITION AND RESULTS OF OPERATIONS —
Continued
For the Years Ended December 31,
2006
2005
2004
(In thousands)
Free Cash Flow
$
882,924
$
267,680
$
20,855
Add back:
Purchases of property and equipment
1,396,318
1,506,394
980,587
Net cash flows from operating activities
$
2,279,242
$
1,774,074
$
1,001,442