Dish Network 2007 Annual Report Download - page 53
Download and view the complete annual report
Please find page 53 of the 2007 Dish Network annual report below. You can navigate through the pages in the report by either clicking on the pages listed below, or by using the keyword search tool below to find specific information within the annual report.-
 1
1 -
2
-
3
-
4
-
5
-
6
-
7
-
8
-
9
-
10
-
11
-
12
-
13
-
14
-
15
-
16
-
17
-
18
-
19
-
20
-
21
-
22
-
23
-
24
-
25
-
26
-
27
-
28
-
29
-
30
-
31
-
32
-
33
-
34
-
35
-
36
-
37
-
38
-
39
-
40
-
41
-
42
-
 43
43 -
 44
44 -
 45
45 -
 46
46 -
 47
47 -
 48
48 -
 49
49 -
 50
50 -
 51
51 -
 52
52 -
 53
53 -
 54
54 -
 55
55 -
 56
56 -
 57
57 -
 58
58 -
 59
59 -
 60
60 -
 61
61 -
 62
62 -
 63
63 -
64
-
65
-
66
-
67
-
68
-
69
-
70
-
71
-
72
-
73
-
74
-
75
-
76
-
77
-
78
-
79
-
80
-
81
-
82
-
83
-
84
-
85
-
86
-
87
-
88
-
89
-
90
-
91
-
92
-
93
-
94
-
95
-
96
-
97
-
98
-
99
-
100
-
101
-
102
-
103
-
104
-
105
-
106
-
107
-
108
-
109
-
110
-
111
-
112
-
113
-
114
-
115
-
116
-
117
-
118
-
119
-
120
-
121
-
122
-
123
-
124
-
125
-
126
-
127
-
128
-
129
-
130
-
131
-
132
-
133
-
134
-
135
-
136
-
137
-
138
-
139
-
140
-
141
-
142
-
143
-
144
-
145
-
146
-
147
-
148
-
149
-
150
-
151
 |
 |

Table of Contents
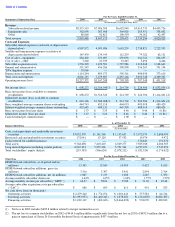
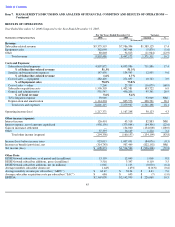
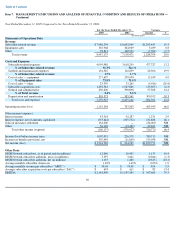
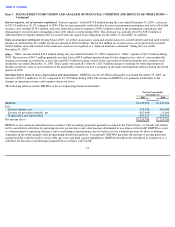
RESULTS OF OPERATIONS
Year Ended December 31, 2006 Compared to the Year Ended December 31, 2005.
45
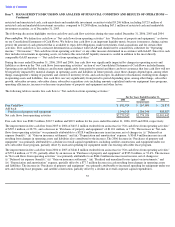
Item 7.
MANAGEMENT’S DISCUSSION AND ANALYSIS OF FINANCIAL CONDITION AND RESULTS OF OPERATIONS —
Continued
For the Years Ended December 31,
Variance
Statements of Operations Data
2006
2005
Amount
%
(In thousands)
Revenue:
Subscriber
-
related revenue
$
9,375,519
$
7,986,394
$
1,389,125
17.4
Equipment sales
362,098
367,968
(5,870
)
(1.6
)
Other
80,869
92,813
(11,944
)
(12.9
)
Total revenue
9,818,486
8,447,175
1,371,311
16.2
Costs and Expenses:
Subscriber
-
related expenses
4,807,872
4,095,986
711,886
17.4
% of Subscriber
-
related revenue
51.3
%
51.3
%
Satellite and transmission expenses
147,450
134,545
12,905
9.6
% of Subscriber
-
related revenue
1.6
%
1.7
%
Cost of sales
—
equipment
282,420
271,697
10,723
3.9
% of Equipment sales
78.0
%
73.8
%
Cost of sales
—
other
7,260
23,339
(16,079
)
(68.9
)
Subscriber acquisition costs
1,596,303
1,492,581
103,722
6.9
General and administrative
551,547
456,206
95,341
20.9
% of Total revenue
5.6
%
5.4
%
TiVo litigation expense
93,969
—
93,969
NM
Depreciation and amortization
1,114,294
805,573
308,721
38.3
Total costs and expenses
8,601,115
7,279,927
1,321,188
18.1
Operating income (loss)
1,217,371
1,167,248
50,123
4.3
Other income (expense):
Interest income
126,401
43,518
82,883
NM
Interest expense, net of amounts capitalized
(458,150
)
(373,844
)
(84,306
)
(22.6
)
Gain on insurance settlement
—
134,000
(134,000
)
(100.0
)
Other
37,393
36,169
1,224
3.4
Total other income (expense)
(294,356
)
(160,157
)
(134,199
)
(83.8
)
Income (loss) before income taxes
923,015
1,007,091
(84,076
)
(8.3
)
Income tax benefit (provision), net
(314,743
)
507,449
(822,192
)
NM
Net income (loss)
$
608,272
$
1,514,540
$
(906,268
)
(59.8
)
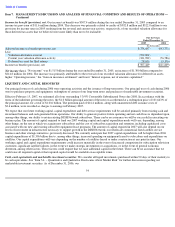
Other Data:
DISH Network subscribers, as of period end (in millions)
13.105
12.040
1.065
8.8
DISH Network subscriber additions, gross (in millions)
3.516
3.397
0.119
3.5
DISH Network subscriber additions, net (in millions)
1.065
1.135
(0.070
)
(6.2
)
Average monthly subscriber churn rate
1.64
%
1.65
%
(0.01
%)
(0.6
)
Average monthly revenue per subscriber (
“
ARPU
”
)
$
62.47
$
58.04
$
4.43
7.6
Average subscriber acquisition costs per subscriber (
“
SAC
”
)
$
686
$
693
$
(7
)
(1.0
)
EBITDA
$
2,369,058
$
2,142,990
$
226,068
10.5