Dish Network 2007 Annual Report Download - page 60
Download and view the complete annual report
Please find page 60 of the 2007 Dish Network annual report below. You can navigate through the pages in the report by either clicking on the pages listed below, or by using the keyword search tool below to find specific information within the annual report.-
 1
1 -
2
-
3
-
4
-
5
-
6
-
7
-
8
-
9
-
10
-
11
-
12
-
13
-
14
-
15
-
16
-
17
-
18
-
19
-
20
-
21
-
22
-
23
-
24
-
25
-
26
-
27
-
28
-
29
-
30
-
31
-
32
-
33
-
34
-
35
-
36
-
37
-
38
-
39
-
40
-
41
-
42
-
43
-
44
-
45
-
46
-
47
-
48
-
49
-
 50
50 -
 51
51 -
 52
52 -
 53
53 -
 54
54 -
 55
55 -
 56
56 -
 57
57 -
 58
58 -
 59
59 -
 60
60 -
 61
61 -
 62
62 -
 63
63 -
 64
64 -
 65
65 -
 66
66 -
 67
67 -
 68
68 -
 69
69 -
 70
70 -
71
-
72
-
73
-
74
-
75
-
76
-
77
-
78
-
79
-
80
-
81
-
82
-
83
-
84
-
85
-
86
-
87
-
88
-
89
-
90
-
91
-
92
-
93
-
94
-
95
-
96
-
97
-
98
-
99
-
100
-
101
-
102
-
103
-
104
-
105
-
106
-
107
-
108
-
109
-
110
-
111
-
112
-
113
-
114
-
115
-
116
-
117
-
118
-
119
-
120
-
121
-
122
-
123
-
124
-
125
-
126
-
127
-
128
-
129
-
130
-
131
-
132
-
133
-
134
-
135
-
136
-
137
-
138
-
139
-
140
-
141
-
142
-
143
-
144
-
145
-
146
-
147
-
148
-
149
-
150
-
151
 |
 |

Table of Contents
2004. These expenses will increase further in the future as we increase the size of our satellite fleet, if we obtain in-orbit satellite insurance, as
we increase the number and operations of our digital broadcast centers and as additional local markets and other programming services are
launched.
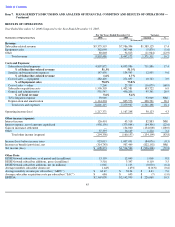
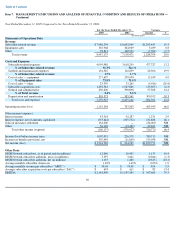
Cost of sales – equipment. “Cost of sales – equipment” totaled $271.7 million during the year ended December 31, 2005, an increase of
$12.6 million or 4.9% compared to 2004. This increase related primarily to the increase in sales of non-DISH Network digital receivers and
related components to an international DBS service provider. Charges for slow moving and obsolete inventory were lower during 2005
compared to 2004. This difference, together with the decrease in sales of DBS accessories domestically discussed above, partially offset the
amount of the increase. “Cost of sales – equipment” represented 73.8% and 71.0% of “Equipment sales,” during the years ended December 31,
2005 and 2004, respectively. The increase in the expense to revenue ratio principally related to a decline in margins on sales to the international
DBS service provider and on sales of DBS accessories domestically. This increase was partially offset by the lower 2005 charges for slow
moving and obsolete inventory.
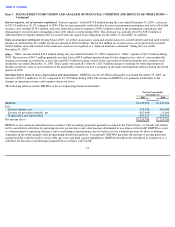
Subscriber acquisition costs.
“Subscriber acquisition costs” totaled $1.493 billion for the year ended December 31, 2005, a decrease of
$35.3 million or 2.3% compared to 2004. The decrease in “Subscriber acquisition costs” was attributable to a higher number of DISH Network
subscribers participating in our equipment lease program for new subscribers, partially offset by an increase in the number of non co-branded
subscribers acquired and an increase in acquisition advertising.
SAC.
SAC was $693 during the year ended December 31, 2005 compared to $611 during 2004, an increase of $82, or 13.4%. This increase
was primarily attributable to a decline in the number of co-
branded subscribers acquired under our original AT&T agreement, for which we did
not incur subscriber acquisition costs and a greater number of DISH Network subscribers activating higher priced advanced products, such as
receivers with multiple tuners, DVRs and HD receivers. Activation of these more advanced and complex products also resulted in higher
installation costs during 2005 as compared to 2004. The increase in SAC was also attributable to higher costs for acquisition advertising and
promotional incentives paid to our independent dealer network.
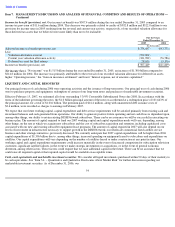
Penetration of our equipment lease program for new subscribers increased during 2005 compared to 2004. The value of equipment capitalized
under our lease program for new subscribers totaled approximately $861.5 million and $574.8 million for the year ended December 31, 2005
and 2004, respectively. The increase in leased equipment and related reduction in subsidized equipment sales caused our capital expenditures to
increase, while our “Subscriber acquisition costs” declined.
As previously discussed, our SAC calculation does not include the benefit of payments we received in connection with equipment not returned
to us from disconnecting lease subscribers and returned equipment that is made available for sale rather than being redeployed through our
lease program. During the years ended December 31, 2005 and 2004, these amounts totaled $86.1 million and $60.8 million, respectively.
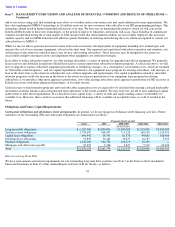
General and administrative expenses. “General and administrative expenses” totaled $456.2 million during the year ended December 31,
2005, an increase of $57.3 million or 14.4% compared to 2004. The increase in “General and administrative expenses” was primarily
attributable to increased personnel and infrastructure expenses to support the growth of the DISH Network. “General and administrative
expenses” represented 5.4% and 5.6% of “Total revenue” during the years ended December 31, 2005 and 2004, respectively. The decrease in
this expense to revenue ratio resulted primarily from “Total revenue” increasing at a higher rate than our “General and administrative
expenses.”
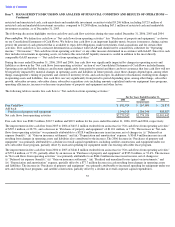
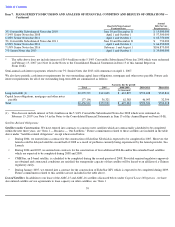
Depreciation and amortization.
“Depreciation and amortization” expense totaled $805.6 million during the year ended December 31, 2005, an
increase of $300.0 million or 59.3% compared to 2004. The increase in “Depreciation and amortization” expense was primarily attributable to
additional depreciation on equipment leased to subscribers resulting from increased penetration of our equipment lease programs and other
depreciable assets placed in service to support the DISH Network. Further, depreciation of our AMC-15 and AMC-16 satellites, which
commenced commercial operation during January and February 2005, respectively, contributed to this increase.
52
Item 7.
MANAGEMENT’S DISCUSSION AND ANALYSIS OF FINANCIAL CONDITION AND RESULTS OF OPERATIONS —
Continued