Dish Network 2007 Annual Report Download - page 107
Download and view the complete annual report
Please find page 107 of the 2007 Dish Network annual report below. You can navigate through the pages in the report by either clicking on the pages listed below, or by using the keyword search tool below to find specific information within the annual report.-
 1
1 -
2
-
3
-
4
-
5
-
6
-
7
-
8
-
9
-
10
-
11
-
12
-
13
-
14
-
15
-
16
-
17
-
18
-
19
-
20
-
21
-
22
-
23
-
24
-
25
-
26
-
27
-
28
-
29
-
30
-
31
-
32
-
33
-
34
-
35
-
36
-
37
-
38
-
39
-
40
-
41
-
42
-
43
-
44
-
45
-
46
-
47
-
48
-
49
-
50
-
51
-
52
-
53
-
54
-
55
-
56
-
57
-
58
-
59
-
60
-
61
-
62
-
63
-
64
-
65
-
66
-
67
-
68
-
69
-
70
-
71
-
72
-
73
-
74
-
75
-
76
-
77
-
78
-
79
-
80
-
81
-
82
-
83
-
84
-
85
-
86
-
87
-
88
-
89
-
90
-
91
-
92
-
93
-
94
-
95
-
96
-
 97
97 -
 98
98 -
 99
99 -
 100
100 -
 101
101 -
 102
102 -
 103
103 -
 104
104 -
 105
105 -
 106
106 -
 107
107 -
 108
108 -
 109
109 -
 110
110 -
 111
111 -
 112
112 -
 113
113 -
 114
114 -
 115
115 -
 116
116 -
 117
117 -
118
-
119
-
120
-
121
-
122
-
123
-
124
-
125
-
126
-
127
-
128
-
129
-
130
-
131
-
132
-
133
-
134
-
135
-
136
-
137
-
138
-
139
-
140
-
141
-
142
-
143
-
144
-
145
-
146
-
147
-
148
-
149
-
150
-
151
 |
 |

Table of Contents
ECHOSTAR COMMUNICATIONS CORPORATION
NOTES TO CONSOLIDATED FINANCIAL STATEMENTS — Continued
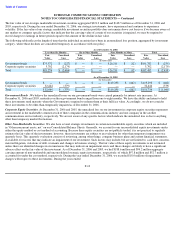
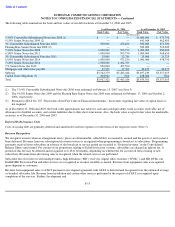
Prior to January 1, 2006, we applied the intrinsic value method of accounting under APB 25 and applied the disclosure only provisions of
SFAS 123. Pro forma information regarding net income and earnings per share was required by SFAS 123 and has been determined as if we
had accounted for our stock-based compensation plans using the fair value method prescribed by that statement. For purposes of pro forma
disclosures, the estimated fair value of the options was amortized to expense over the options’ vesting period on a straight-line basis. We
accounted for forfeitures as they occurred. Compensation previously recognized was reversed in the event of forfeitures of unvested options.
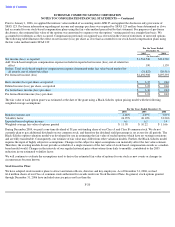
The following table illustrates the effect on net income (loss) per share as if we had accounted for our stock-based compensation plans using
the fair value method under SFAS 123:
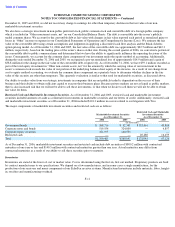
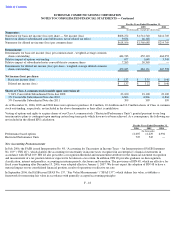
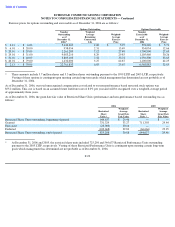
The fair value of each option grant was estimated at the date of the grant using a Black-Scholes option pricing model with the following
weighted-average assumptions:
During December 2004, we paid a one-time dividend of $1 per outstanding share of our Class A and Class B common stock. We do not
currently plan to pay additional dividends on our common stock, and therefore the dividend yield percentage is set at zero for all periods. The
Black-Scholes option valuation model was developed for use in estimating the fair value of traded options which have no vesting restrictions
and are fully transferable. Consequently, our estimate of fair value may differ from other valuation models. Further, the Black-Scholes model
requires the input of highly subjective assumptions. Changes in the subjective input assumptions can materially affect the fair value estimate.
Therefore, the existing models do not provide as reliable of a single measure of the fair value of stock-based compensation awards as a market-
based model would. Changes in the intervals of our regular historical price observations from daily to monthly, contributed to the 2005
reduction in our estimated volatility factor.
We will continue to evaluate the assumptions used to derive the estimated fair value of options for our stock as new events or changes in
circumstances become known.
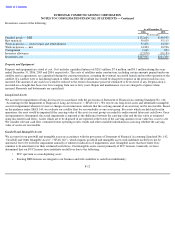
Stock Incentive Plans
We have adopted stock incentive plans to attract and retain officers, directors and key employees. As of December 31, 2006, we had
66.6 million shares of our Class A common stock authorized for awards under our Stock Incentive Plans. In general, stock options granted
through December 31, 2006 have included exercise prices not less than the
F-20
For the Years Ended
December 31,
2005
2004
(In thousands)
Net income (loss), as reported
$
1,514,540
$
214,769
Add: Stock-based employee compensation expense included in reported net income (loss), net of related tax
effect
190
1,139
Deduct: Total stock-based employee compensation expense determined under fair value based method for
all awards, net of related tax effect
(21,822
)
(20,515
)
Pro forma net income (loss)
$
1,492,908
$
195,393
Basic income (loss) per share, as reported
$
3.35
$
0.46
Diluted income (loss) per share, as reported
$
3.22
$
0.46
Pro forma basic income (loss) per share
$
3.30
$
0.42
Pro forma diluted income (loss) per share
$
3.18
$
0.42
For the Years Ended December 31,
2006
2005
2004
Risk
-
free interest rate
4.68
%
4.09
%
3.69
%
Volatility factor
24.99
%
26.10
%
33.26
%
Expected term of options in years
6.1
6.2
5.4
Weighted
-
average fair value of options granted
$
11.58
$
10.22
$
11.66