Dish Network 2007 Annual Report Download - page 121
Download and view the complete annual report
Please find page 121 of the 2007 Dish Network annual report below. You can navigate through the pages in the report by either clicking on the pages listed below, or by using the keyword search tool below to find specific information within the annual report.-
 1
1 -
2
-
3
-
4
-
5
-
6
-
7
-
8
-
9
-
10
-
11
-
12
-
13
-
14
-
15
-
16
-
17
-
18
-
19
-
20
-
21
-
22
-
23
-
24
-
25
-
26
-
27
-
28
-
29
-
30
-
31
-
32
-
33
-
34
-
35
-
36
-
37
-
38
-
39
-
40
-
41
-
42
-
43
-
44
-
45
-
46
-
47
-
48
-
49
-
50
-
51
-
52
-
53
-
54
-
55
-
56
-
57
-
58
-
59
-
60
-
61
-
62
-
63
-
64
-
65
-
66
-
67
-
68
-
69
-
70
-
71
-
72
-
73
-
74
-
75
-
76
-
77
-
78
-
79
-
80
-
81
-
82
-
83
-
84
-
85
-
86
-
87
-
88
-
89
-
90
-
91
-
92
-
93
-
94
-
95
-
96
-
97
-
98
-
99
-
100
-
101
-
102
-
103
-
104
-
105
-
106
-
107
-
108
-
109
-
110
-
 111
111 -
 112
112 -
 113
113 -
 114
114 -
 115
115 -
 116
116 -
 117
117 -
 118
118 -
 119
119 -
 120
120 -
 121
121 -
 122
122 -
 123
123 -
 124
124 -
 125
125 -
 126
126 -
 127
127 -
 128
128 -
 129
129 -
 130
130 -
 131
131 -
132
-
133
-
134
-
135
-
136
-
137
-
138
-
139
-
140
-
141
-
142
-
143
-
144
-
145
-
146
-
147
-
148
-
149
-
150
-
151
 |
 |
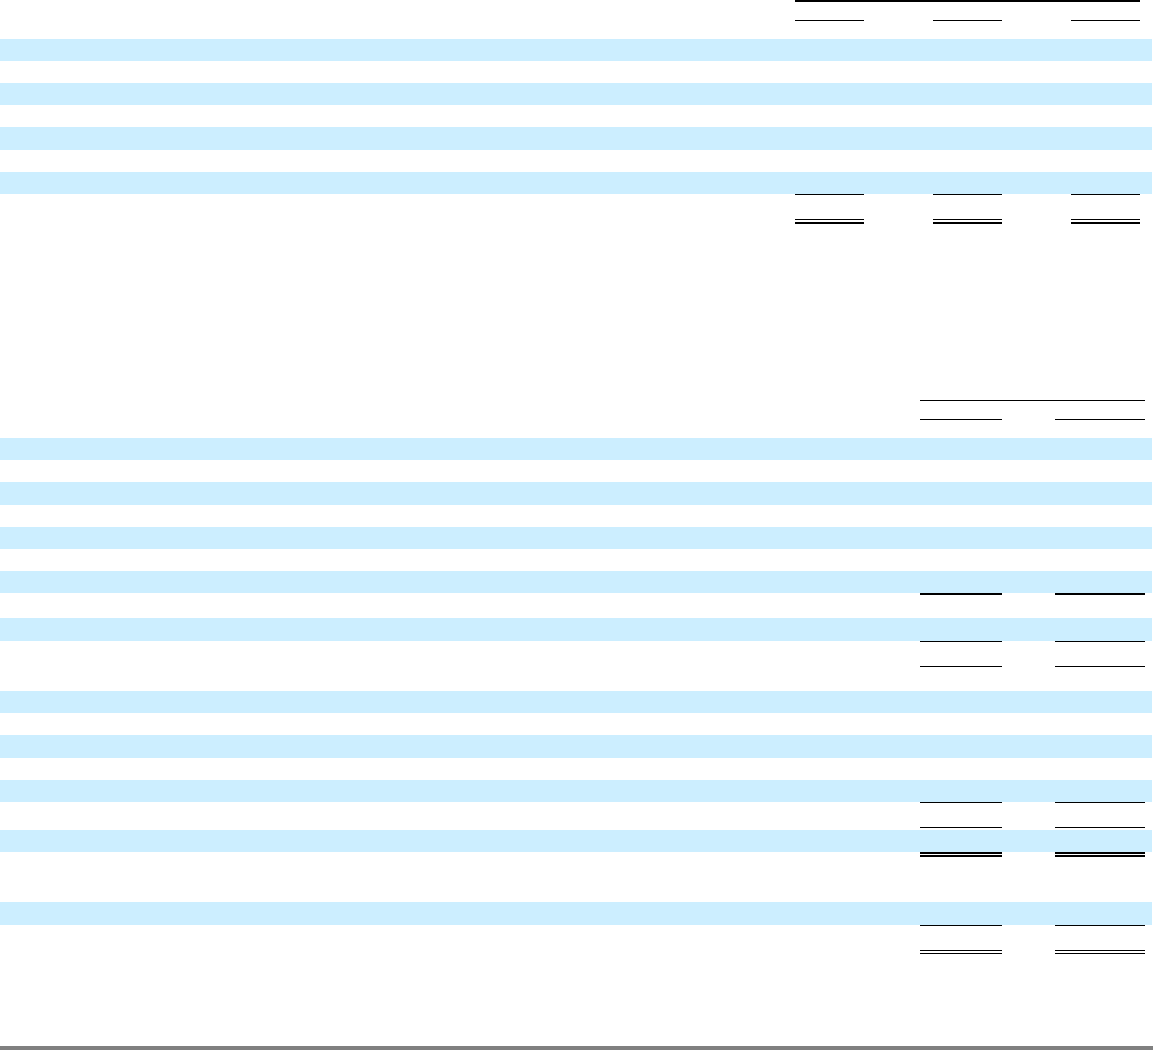
Table of Contents
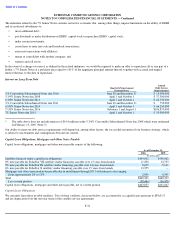
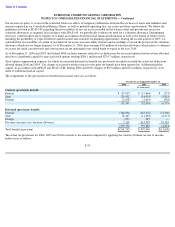
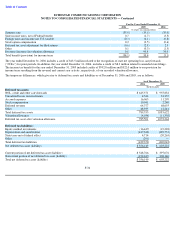
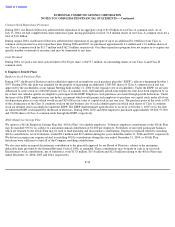
ECHOSTAR COMMUNICATIONS CORPORATION
NOTES TO CONSOLIDATED FINANCIAL STATEMENTS — Continued
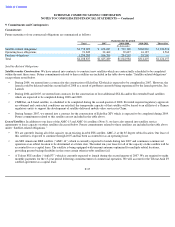
The year ended December 31, 2006 includes a credit of $13.5 million related to the recognition of state net operating loss carryforwards
(“NOLs”) for prior periods. In addition, the year ended December 31, 2006, includes a credit of $8.3 million related to amended state filings.
The income tax benefit for the year ended December 31, 2005 included credits of $592.8 million and $322.0 million to our provision for
income taxes resulting from the reversal and current year activity, respectively, of our recorded valuation allowance.
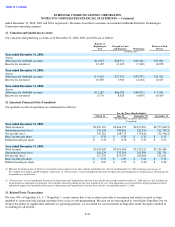
The temporary differences, which give rise to deferred tax assets and liabilities as of December 31, 2006 and 2005, are as follows:
F-34
For the Years Ended December 31,
2006
2005
2004
% of pre
-
tax (income)/loss
Statutory rate
(35.0
)
(35.0
)
(35.0
)
State income taxes, net of Federal benefit
0.7
(1.7
)
(3.5
)
Foreign taxes and income not U.S. taxable
(0.3
)
(0.1
)
(0.8
)
Stock option compensation
0.2
(0.5
)
(0.6
)
Deferred tax asset adjustment for filed returns
(0.6
)
(2.8
)
2.3
Other
0.1
(0.3
)
(1.5
)
Decrease (increase) in valuation allowance
0.8
90.8
34.0
Total benefit (provision) for income taxes
(34.1
)
50.4
(5.1
)
As of December 31,
2006
2005
(In thousands)
Deferred tax assets:
NOL, credit and other carryforwards
$
645,571
$
955,832
Unrealized losses on investments
4,546
33,355
Accrued expenses
16,065
11,299
Stock compensation
10,041
2,240
Deferred revenue
64,377
68,655
Other
48,935
12,241
Total deferred tax assets
789,535
1,083,622
Valuation allowance
(4,034
)
(11,358
)
Deferred tax asset after valuation allowance
785,501
1,072,264
Deferred tax liabilities:
Equity method investments
(16,447
)
(19,228
)
Depreciation and amortization
(417,328
)
(429,551
)
State taxes net of federal effect
4,714
(20,263
)
Other
(291
)
—
Total deferred tax liabilities
(429,352
)
(469,042
)
Net deferred tax asset (liability)
$
356,149
$
603,222
Current portion of net deferred tax asset (liability)
$
548,766
$
397,076
Noncurrent portion of net deferred tax asset (liability)
(192,617
)
206,146
Total net deferred tax asset (liability)
$
356,149
$
603,222