Dish Network 2007 Annual Report Download - page 64
Download and view the complete annual report
Please find page 64 of the 2007 Dish Network annual report below. You can navigate through the pages in the report by either clicking on the pages listed below, or by using the keyword search tool below to find specific information within the annual report.-
 1
1 -
2
-
3
-
4
-
5
-
6
-
7
-
8
-
9
-
10
-
11
-
12
-
13
-
14
-
15
-
16
-
17
-
18
-
19
-
20
-
21
-
22
-
23
-
24
-
25
-
26
-
27
-
28
-
29
-
30
-
31
-
32
-
33
-
34
-
35
-
36
-
37
-
38
-
39
-
40
-
41
-
42
-
43
-
44
-
45
-
46
-
47
-
48
-
49
-
50
-
51
-
52
-
53
-
 54
54 -
 55
55 -
 56
56 -
 57
57 -
 58
58 -
 59
59 -
 60
60 -
 61
61 -
 62
62 -
 63
63 -
 64
64 -
 65
65 -
 66
66 -
 67
67 -
 68
68 -
 69
69 -
 70
70 -
 71
71 -
 72
72 -
 73
73 -
 74
74 -
75
-
76
-
77
-
78
-
79
-
80
-
81
-
82
-
83
-
84
-
85
-
86
-
87
-
88
-
89
-
90
-
91
-
92
-
93
-
94
-
95
-
96
-
97
-
98
-
99
-
100
-
101
-
102
-
103
-
104
-
105
-
106
-
107
-
108
-
109
-
110
-
111
-
112
-
113
-
114
-
115
-
116
-
117
-
118
-
119
-
120
-
121
-
122
-
123
-
124
-
125
-
126
-
127
-
128
-
129
-
130
-
131
-
132
-
133
-
134
-
135
-
136
-
137
-
138
-
139
-
140
-
141
-
142
-
143
-
144
-
145
-
146
-
147
-
148
-
149
-
150
-
151
 |
 |

Table of Contents
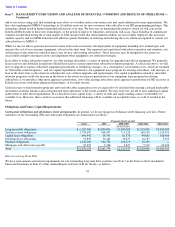
Our future capital expenditures could increase or decrease depending on the strength of the economy, strategic opportunities or other factors.
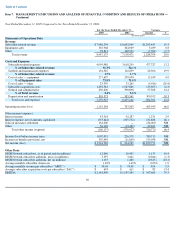
Cash flows from operating activities. We typically reinvest the cash flow from operating activities in our business primarily to grow our
subscriber base and to expand our infrastructure. For the years ended December 31, 2006, 2005 and 2004, we reported net cash flows from
operating activities of $2.279 billion, $1.774 billion, and $1.001 billion, respectively. See discussion of changes in net cash flows from
operating activities included in “Free cash flow” above.
Cash flows from investing activities. Our investing activities generally include purchases and sales of marketable investment securities and
cash used to grow our subscriber base and expand our infrastructure. For the years ended December 31, 2006 and 2005, we reported net cash
outflows from investing activities of $1.994 billion and $1.460 billion. For the year ended December 31, 2004, we reported net cash inflows
from investing activities of $1.078 billion.
The decrease in cash flow from investing activities from 2005 to 2006 of $533.6 million primarily resulted from an increase in net purchases of
marketable investment securities; partially offset by a decrease in cash used for capital expenditures during 2006. Cash flow from investing
activities for 2005 was favorably impacted by a $240.0 million insurance settlement.
The decrease from 2004 to 2005 of $2.538 billion primarily resulted from a decrease in net sales of marketable investment securities and an
increase in cash used for capital expenditures during 2005. The decrease in net cash flows from investing activities was partially offset by an
increase in cash due to the insurance settlement of $240.0 million previously disclosed and the decrease in asset acquisitions during 2005.
Cash flows from financing activities. Our financing activities include net proceeds related to the issuance of long-term debt, and cash used for
the repurchase or redemption of long-term debt, and capital lease obligations, mortgages or other notes payable, repurchases of our Class A
common stock and dividends. For the year ended December 31, 2006, we reported net cash inflows from financing activities of $1.022 billion.
For the years ended December 31, 2005 and 2004, we reported net cash outflows from financing activities of $402.6 million and $2.666 billion,
respectively.
The improvement from 2005 to 2006 of $1.425 billion principally resulted from the following:
The improvement from 2004 to 2005 of $2.263 billion principally resulted from the following:
56
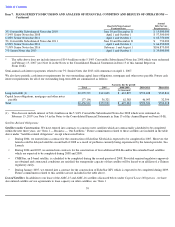
Item 7.
MANAGEMENT’S DISCUSSION AND ANALYSIS OF FINANCIAL CONDITION AND RESULTS OF OPERATIONS —
Continued
•
On February 2, 2006, we sold $1.5 billion principal amount of our 7 1/8% Senior Notes due 2016.
•
On October 18, 2006, we sold $500.0 million principal amount of our 7% Senior Notes due 2013.
•
On February 17, 2006, we redeemed the remaining $442.0 million outstanding principal amount of our 9 1/8% Senior Notes due 2009.
•
On October 1, 2006, we redeemed the $500.0 million outstanding principal amount of our Rate Senior Notes due 2008.
• During 2006, we repurchased approximately 429,000 shares of our Class A common stock in open market transactions for a total cost
of $11.7 million compared to approximately 13.2 million shares at a total cost of $362.5 million during 2005.
• During 2004, we redeemed the remaining $1.423 billion outstanding principal amount of our 9 3/8% Senior Notes due 2009 and our
$1.0 billion outstanding principal amount of the 10 3/8% Senior Notes due 2007.