Dish Network 2007 Annual Report Download - page 54
Download and view the complete annual report
Please find page 54 of the 2007 Dish Network annual report below. You can navigate through the pages in the report by either clicking on the pages listed below, or by using the keyword search tool below to find specific information within the annual report.-
 1
1 -
2
-
3
-
4
-
5
-
6
-
7
-
8
-
9
-
10
-
11
-
12
-
13
-
14
-
15
-
16
-
17
-
18
-
19
-
20
-
21
-
22
-
23
-
24
-
25
-
26
-
27
-
28
-
29
-
30
-
31
-
32
-
33
-
34
-
35
-
36
-
37
-
38
-
39
-
40
-
41
-
42
-
43
-
 44
44 -
 45
45 -
 46
46 -
 47
47 -
 48
48 -
 49
49 -
 50
50 -
 51
51 -
 52
52 -
 53
53 -
 54
54 -
 55
55 -
 56
56 -
 57
57 -
 58
58 -
 59
59 -
 60
60 -
 61
61 -
 62
62 -
 63
63 -
 64
64 -
65
-
66
-
67
-
68
-
69
-
70
-
71
-
72
-
73
-
74
-
75
-
76
-
77
-
78
-
79
-
80
-
81
-
82
-
83
-
84
-
85
-
86
-
87
-
88
-
89
-
90
-
91
-
92
-
93
-
94
-
95
-
96
-
97
-
98
-
99
-
100
-
101
-
102
-
103
-
104
-
105
-
106
-
107
-
108
-
109
-
110
-
111
-
112
-
113
-
114
-
115
-
116
-
117
-
118
-
119
-
120
-
121
-
122
-
123
-
124
-
125
-
126
-
127
-
128
-
129
-
130
-
131
-
132
-
133
-
134
-
135
-
136
-
137
-
138
-
139
-
140
-
141
-
142
-
143
-
144
-
145
-
146
-
147
-
148
-
149
-
150
-
151
 |
 |

Table of Contents
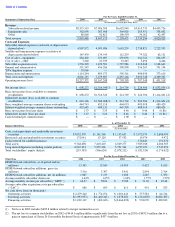
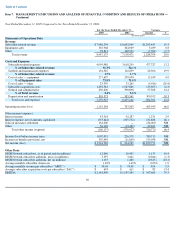
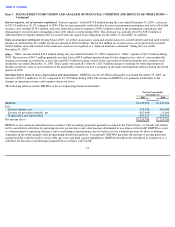
DISH Network subscribers
. As of December 31, 2006, we had approximately 13.105 million DISH Network subscribers compared to
approximately 12.040 million subscribers at December 31, 2005, an increase of 8.8%. DISH Network added approximately 3.516 million gross
new subscribers for the year ended December 31, 2006, compared to approximately 3.397 million gross new subscribers during 2005, an
increase of approximately 119,000. The increase in gross new subscribers resulted in large part from increased advertising and the effectiveness
of our promotions and products during the year. A substantial majority of our gross new subscribers are acquired through our equipment lease
program.
DISH Network added approximately 1.065 million net new subscribers for the year ended December 31, 2006, compared to approximately
1.135 million net new subscribers during 2005, a decrease of 6.2%. This decrease was primarily a result of subscriber churn on a larger
subscriber base. As the size of our subscriber base increases, even if our subscriber churn rate remains constant or declines, increasing numbers
of gross new DISH Network subscribers are required to sustain net subscriber growth.
Our gross new subscribers, our net new subscriber additions, and our entire subscriber base are negatively impacted when existing and new
competitors offer more attractive alternatives, including, among other things, video services bundled with broadband and other
telecommunications services, better priced or more attractive programming packages or more compelling consumer electronic products and
services, including DVRs, VOD services, receivers with multiple tuners, HD programming, or HD and standard definition local channels. We
also expect to face increasing competition from content and other providers who distribute video services directly to consumers over the
Internet. In addition, we will be unable to continue to grow our subscriber base at current rates if we cannot control our customer churn.
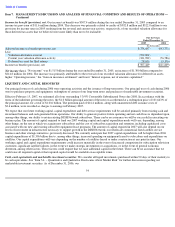
Subscriber
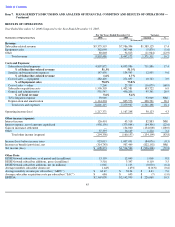
-related revenue. DISH Network “Subscriber-related revenue” totaled $9.376 billion for the year ended December 31, 2006, an
increase of $1.389 billion or 17.4% compared to 2005. This increase was directly attributable to continued DISH Network subscriber growth
and the increase in “ARPU” discussed below.
ARPU
. Monthly average revenue per subscriber was $62.47 during the year ended December 31, 2006 versus $58.04 during the same period
in 2005. The $4.43 or 7.6% increase in ARPU was primarily attributable to price increases in February 2006 and 2005 on some of our most
popular packages, higher equipment rental fees resulting from increased penetration of our equipment leasing programs, fees for DVRs,
revenue from increased availability of standard and HD local channels by satellite, fees earned from our DishHOME Protection Plan, and HD
programming. This increase was partially offset by a decrease in revenues from installation and other services related to our original agreement
with AT&T.
Equipment sales
. For the year ended December 31, 2006, “Equipment sales” totaled $362.1 million, a decrease of $5.9 million or 1.6%
compared to 2005. This decrease principally resulted from a decline in domestic sales of DBS accessories, partially offset by an increase in
sales of non-DISH Network digital receivers and related components to international customers.
While we currently have certain binding purchase orders from Bell ExpressVu and others through mid-year 2007, we anticipate that 2007 sales
could decline compared to 2006. In addition, the availability of new compression technology could impact our relationship with Bell
ExpressVu depending on its strategy to upgrade customers. There can be no assurance that Bell ExpressVu will continue to use our equipment
in the future.
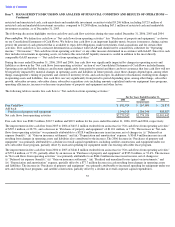
Subscriber
-related expenses. “Subscriber-related expenses” totaled $4.808 billion during the year ended December 31, 2006, an increase of
$711.9 million or 17.4% compared to 2005. The increase in “Subscriber-related expenses” was primarily attributable to the increase in the
number of DISH Network subscribers together with an increase in refurbishment and repair costs for returned EchoStar receiver systems,
partially offset by the decline in costs associated with installation and other services related to our original agreement with AT&T. “Subscriber-
related expenses” represented 51.3% of “Subscriber-related revenue” for each of the years ended December 31, 2006 and 2005.
In the normal course of business, we enter into various contracts with programmers to provide content. Our programming contracts generally
require us to make payments based on the number of subscribers to which the respective content is provided. Consequently, our programming
expenses will continue to increase to the extent we are successful in growing our subscriber base. In addition, because programmers continue to
raise the price of content, our
46
Item 7.
MANAGEMENT’S DISCUSSION AND ANALYSIS OF FINANCIAL CONDITION AND RESULTS OF OPERATIONS —
Continued