Dish Network 2007 Annual Report Download - page 61
Download and view the complete annual report
Please find page 61 of the 2007 Dish Network annual report below. You can navigate through the pages in the report by either clicking on the pages listed below, or by using the keyword search tool below to find specific information within the annual report.-
 1
1 -
2
-
3
-
4
-
5
-
6
-
7
-
8
-
9
-
10
-
11
-
12
-
13
-
14
-
15
-
16
-
17
-
18
-
19
-
20
-
21
-
22
-
23
-
24
-
25
-
26
-
27
-
28
-
29
-
30
-
31
-
32
-
33
-
34
-
35
-
36
-
37
-
38
-
39
-
40
-
41
-
42
-
43
-
44
-
45
-
46
-
47
-
48
-
49
-
50
-
 51
51 -
 52
52 -
 53
53 -
 54
54 -
 55
55 -
 56
56 -
 57
57 -
 58
58 -
 59
59 -
 60
60 -
 61
61 -
 62
62 -
 63
63 -
 64
64 -
 65
65 -
 66
66 -
 67
67 -
 68
68 -
 69
69 -
 70
70 -
 71
71 -
72
-
73
-
74
-
75
-
76
-
77
-
78
-
79
-
80
-
81
-
82
-
83
-
84
-
85
-
86
-
87
-
88
-
89
-
90
-
91
-
92
-
93
-
94
-
95
-
96
-
97
-
98
-
99
-
100
-
101
-
102
-
103
-
104
-
105
-
106
-
107
-
108
-
109
-
110
-
111
-
112
-
113
-
114
-
115
-
116
-
117
-
118
-
119
-
120
-
121
-
122
-
123
-
124
-
125
-
126
-
127
-
128
-
129
-
130
-
131
-
132
-
133
-
134
-
135
-
136
-
137
-
138
-
139
-
140
-
141
-
142
-
143
-
144
-
145
-
146
-
147
-
148
-
149
-
150
-
151
 |
 |

Table of Contents
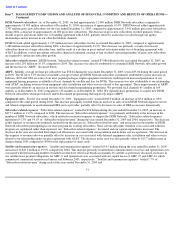
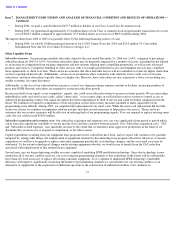
Interest expense, net of amounts capitalized.
“Interest expense” totaled $373.8 million during the year ended December 31, 2005, a decrease
of $131.9 million or 26.1% compared to 2004. This decrease primarily resulted from a decrease in prepayment premiums and write-off of debt
issuance costs totaling $134.4 million, and a net reduction in interest expense of $40.2 million related to the redemption, repurchases and
refinancing of our previously outstanding senior debt which occurred during 2004. This decrease was partially offset by $38.0 million of
additional interest expense during 2005 associated with our capital lease obligations for the AMC-15 and AMC-16 satellites.
Gain on insurance settlement. During March 2005, we settled an insurance claim and related claims for accrued interest and bad faith with the
insurers of our EchoStar IV satellite for the net amount of $240.0 million. The $134.0 million received in excess of our previously recorded
$106.0 million receivable related to this insurance claim was recognized as a “Gain on insurance settlement” during the year ended
December 31, 2005.
Other. “Other” income totaled $36.2 million during the year ended December 31, 2005 compared to “Other” expense of $13.5 million during
2004. The increase of $49.7 million primarily resulted from a $38.8 million unrealized gain for the change in fair value of a non-marketable
strategic investment accounted for at fair value and $28.4 million in gains related to the conversion of bond instruments into common stock
during the year ended December 31, 2005. These gains were partially offset by a $25.4 million charge to earnings for other than temporary
declines in the fair value of an investment in the marketable common stock of a company in the home entertainment industry during the fourth
quarter of 2005.
Earnings before interest, taxes, depreciation and amortization
. EBITDA was $2.143 billion during the year ended December 31, 2005, an
increase of $947.6 million or 79.3% compared to $1.195 billion during 2004. The increase in EBITDA was primarily attributable to the
changes in operating revenues and expenses discussed above.
The following table reconciles EBITDA to the accompanying financial statements:
EBITDA is not a measure determined in accordance with accounting principles generally accepted in the United States, or GAAP, and should
not be considered a substitute for operating income, net income or any other measure determined in accordance with GAAP. EBITDA is used
as a measurement of operating efficiency and overall financial performance and we believe it to be a helpful measure for those evaluating
companies in the multi-channel video programming distribution industry. Conceptually, EBITDA measures the amount of income generated
each period that could be used to service debt, pay taxes and fund capital expenditures. EBITDA should not be considered in isolation or as a
substitute for measures of performance prepared in accordance with GAAP.
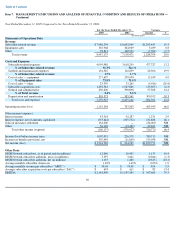
53
Item 7.
MANAGEMENT’S DISCUSSION AND ANALYSIS OF FINANCIAL CONDITION AND RESULTS OF OPERATIONS —
Continued
For the Years Ended
December 31,
2005
2004
(In thousands)
EBITDA
$
2,142,990
$
1,195,384
Less:
Interest expense, net
330,326
463,445
Income tax provision (benefit), net
(507,449
)
11,609
Depreciation and amortization
805,573
505,561
Net income (loss)
$
1,514,540
$
214,769