Dish Network 2007 Annual Report Download - page 56
Download and view the complete annual report
Please find page 56 of the 2007 Dish Network annual report below. You can navigate through the pages in the report by either clicking on the pages listed below, or by using the keyword search tool below to find specific information within the annual report.-
 1
1 -
2
-
3
-
4
-
5
-
6
-
7
-
8
-
9
-
10
-
11
-
12
-
13
-
14
-
15
-
16
-
17
-
18
-
19
-
20
-
21
-
22
-
23
-
24
-
25
-
26
-
27
-
28
-
29
-
30
-
31
-
32
-
33
-
34
-
35
-
36
-
37
-
38
-
39
-
40
-
41
-
42
-
43
-
44
-
45
-
 46
46 -
 47
47 -
 48
48 -
 49
49 -
 50
50 -
 51
51 -
 52
52 -
 53
53 -
 54
54 -
 55
55 -
 56
56 -
 57
57 -
 58
58 -
 59
59 -
 60
60 -
 61
61 -
 62
62 -
 63
63 -
 64
64 -
 65
65 -
 66
66 -
67
-
68
-
69
-
70
-
71
-
72
-
73
-
74
-
75
-
76
-
77
-
78
-
79
-
80
-
81
-
82
-
83
-
84
-
85
-
86
-
87
-
88
-
89
-
90
-
91
-
92
-
93
-
94
-
95
-
96
-
97
-
98
-
99
-
100
-
101
-
102
-
103
-
104
-
105
-
106
-
107
-
108
-
109
-
110
-
111
-
112
-
113
-
114
-
115
-
116
-
117
-
118
-
119
-
120
-
121
-
122
-
123
-
124
-
125
-
126
-
127
-
128
-
129
-
130
-
131
-
132
-
133
-
134
-
135
-
136
-
137
-
138
-
139
-
140
-
141
-
142
-
143
-
144
-
145
-
146
-
147
-
148
-
149
-
150
-
151
 |
 |

Table of Contents
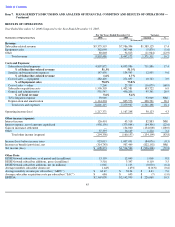
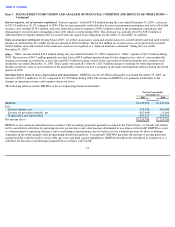
As previously discussed, our SAC calculation does not include the benefit of payments we received in connection with equipment not returned
to us from disconnecting lease subscribers and returned equipment that is made available for sale rather than being redeployed through our
lease program. During the years ended December 31, 2006 and 2005, these amounts totaled $120.5 million and $86.1 million, respectively.
Our “Subscriber acquisition costs,” both in aggregate and on a per new subscriber activation basis, may materially increase in the future to the
extent that we introduce more aggressive promotions if we determine that they are necessary to respond to competition, or for other reasons.
See further discussion under “Liquidity and Capital Resources – Subscriber Retention and Acquisition Costs.”
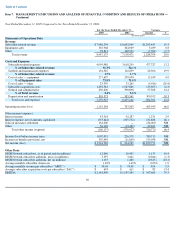
General and administrative expenses. “General and administrative expenses” totaled $551.5 million during the year ended December 31,
2006, an increase of $95.3 million or 20.9% compared to 2005. This increase was primarily attributable to increased personnel and related costs
to support the growth of the DISH Network, including, among other things, non-cash, stock-based compensation expense recorded related to
the adoption of SFAS 123R, outside professional fees and non-income based taxes. “General and administrative expenses” represented 5.6%
and 5.4% of “Total revenue” during the years ended December 31, 2006 and 2005, respectively. The increase in the ratio of those expenses to
“Total revenue” was primarily attributable to increased infrastructure expenses to support the growth of the DISH Network, discussed above.
Tivo litigation expense. We recorded $94.0 million of “Tivo litigation expense” during the year ended December 31, 2006 as a result of the
jury verdict in the Tivo lawsuit. Based on our current analysis of the case, including the appellate record and other factors, we believe it is more
likely than not that we will prevail on appeal. Consequently, only the expense related to the original judgment has been accrued.
Depreciation and amortization.
“Depreciation and amortization” expense totaled $1.114 billion during the year ended December 31, 2006, an
increase of $308.7 million or 38.3% compared to 2005. The increase in “Depreciation and amortization” expense was primarily attributable to
depreciation of equipment leased to subscribers resulting from increased penetration of our equipment lease programs, additional depreciation
related to satellites placed in service and other depreciable assets placed in service to support the DISH Network.
Interest income.
“Interest income” totaled $126.4 million during the year ended December 31, 2006, an increase of $82.9 million compared to
2005. This increase principally resulted from higher cash and marketable investment securities balances and higher total percentage returns
earned on our cash and marketable investment securities during 2006.
Interest expense, net of amounts capitalized.
“Interest expense” totaled $458.2 million during the year ended December 31, 2006, an increase
of $84.3 million or 22.6% compared to 2005. This increase primarily resulted from a net increase in interest expense of $65.1 million related to
the issuance of additional senior debt during 2006, net of redemptions, and an increase in prepayment premiums and write-off of debt issuance
costs totaling $28.7 million, related to the redemption of certain outstanding senior debt during 2006. This increase was partially offset by an
increase in capitalized interest on construction of satellites.
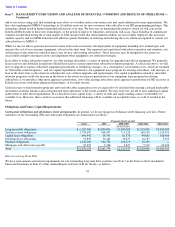
Earnings before interest, taxes, depreciation and amortization
. EBITDA was $2.369 billion during the year ended December 31, 2006, an
increase of $226.0 million or 10.5% compared to 2005. EBITDA for the year ended December 31, 2005 was favorably impacted by the
$134.0 million “Gain on insurance settlement” and the year ended December 31, 2006 was negatively impacted by the $94.0 million “Tivo
litigation expense.” Absent these items, our EBITDA for the year ended December 31, 2006 would have been $454.0 million or 22.6% higher
than EBITDA in 2005. The increase in EBITDA (excluding these items) was primarily attributable to changes in operating revenues and
expenses discussed above.
48
Item 7.
MANAGEMENT’S DISCUSSION AND ANALYSIS OF FINANCIAL CONDITION AND RESULTS OF OPERATIONS —
Continued