Columbia Sportswear 2009 Annual Report Download - page 71
Download and view the complete annual report
Please find page 71 of the 2009 Columbia Sportswear annual report below. You can navigate through the pages in the report by either clicking on the pages listed below, or by using the keyword search tool below to find specific information within the annual report.-
 1
1 -
2
-
3
-
4
-
5
-
6
-
7
-
8
-
9
-
10
-
11
-
12
-
13
-
14
-
15
-
16
-
17
-
18
-
19
-
20
-
21
-
22
-
23
-
24
-
25
-
26
-
27
-
28
-
29
-
30
-
31
-
32
-
33
-
34
-
35
-
36
-
37
-
38
-
39
-
40
-
41
-
42
-
43
-
44
-
45
-
46
-
47
-
48
-
49
-
50
-
51
-
52
-
53
-
54
-
55
-
56
-
57
-
58
-
59
-
60
-
 61
61 -
 62
62 -
 63
63 -
 64
64 -
 65
65 -
 66
66 -
 67
67 -
 68
68 -
 69
69 -
 70
70 -
 71
71 -
 72
72 -
 73
73 -
 74
74 -
 75
75 -
 76
76 -
 77
77 -
 78
78 -
 79
79 -
 80
80 -
 81
81 -
82
-
83
-
84
-
85
 |
 |

COLUMBIA SPORTSWEAR COMPANY
NOTES TO CONSOLIDATED FINANCIAL STATEMENTS—(Continued)
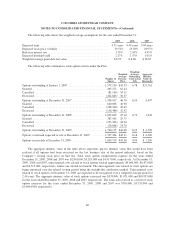
The geographic distribution of the Company’s net sales, income before income taxes, interest income
(expense), income tax expense (benefit), depreciation and amortization expense and identifiable assets are
summarized in the following tables (in thousands) for, and for the years ended, December 31, 2009, 2008 and
2007. Inter-geographic net sales, which are recorded at a negotiated mark-up and eliminated in consolidation, are
not material.
2009 2008 2007
Net sales to unrelated entities:
United States ........................................... $ 736,942 $ 727,706 $ 767,198
EMEA ................................................ 197,357 267,152 286,968
LAAP ................................................ 203,230 198,236 175,725
Canada ................................................ 106,494 124,741 126,148
$1,244,023 $1,317,835 $1,356,039
Income before income taxes:
United States ........................................... $ 49,660 $ 38,674 $ 112,986
EMEA ................................................ 1,410 26,167 29,210
LAAP ................................................ 27,138 32,857 29,585
Canada ................................................ 9,554 21,008 27,195
Interest and other income and eliminations ................... 2,088 7,537 9,051
$ 89,850 $ 126,243 $ 208,027
Interest income (expense), net:
United States ........................................... $ 4,561 $ 5,804 $ 9,602
EMEA ................................................ (910) 45 (1,856)
LAAP ................................................ 561 1,023 482
Canada ................................................ (2,124) 665 660
$ 2,088 $ 7,537 $ 8,888
Income tax (expense) benefit:
United States ........................................... $ (13,710) $ (13,363) $ (41,227)
EMEA ................................................ (2,744) (2,692) (5,185)
LAAP ................................................ (6,745) (8,312) (7,084)
Canada ................................................ 370 (6,829) (10,079)
$ (22,829) $ (31,196) $ (63,575)
Depreciation and amortization expense:
United States ........................................... $ 26,850 $ 21,866 $ 18,643
EMEA ................................................ 6,642 6,978 9,910
LAAP ................................................ 2,120 1,865 1,540
Canada ................................................ 641 449 245
$ 36,253 $ 31,158 $ 30,338
64