Columbia Sportswear 2009 Annual Report Download - page 40
Download and view the complete annual report
Please find page 40 of the 2009 Columbia Sportswear annual report below. You can navigate through the pages in the report by either clicking on the pages listed below, or by using the keyword search tool below to find specific information within the annual report.-
 1
1 -
2
-
3
-
4
-
5
-
6
-
7
-
8
-
9
-
10
-
11
-
12
-
13
-
14
-
15
-
16
-
17
-
18
-
19
-
20
-
21
-
22
-
23
-
24
-
25
-
26
-
27
-
28
-
29
-
 30
30 -
 31
31 -
 32
32 -
 33
33 -
 34
34 -
 35
35 -
 36
36 -
 37
37 -
 38
38 -
 39
39 -
 40
40 -
 41
41 -
 42
42 -
 43
43 -
 44
44 -
 45
45 -
 46
46 -
 47
47 -
 48
48 -
 49
49 -
 50
50 -
51
-
52
-
53
-
54
-
55
-
56
-
57
-
58
-
59
-
60
-
61
-
62
-
63
-
64
-
65
-
66
-
67
-
68
-
69
-
70
-
71
-
72
-
73
-
74
-
75
-
76
-
77
-
78
-
79
-
80
-
81
-
82
-
83
-
84
-
85
 |
 |
Selling expenses, including commissions and advertising, increased to 9.2% of net sales in 2008 from 8.3%
of net sales in 2007. We attribute the increase in selling expenses as a percentage of net sales to our increased
marketing investments to drive consumer demand for our brands, which was amplified by a decrease in
consolidated net sales in 2008 compared with the same period in 2007.
The increase in general and administrative expenses primarily resulted from the start-up and operational
costs of our new retail stores. Depreciation and amortization included in SG&A expense totaled $30.1 million for
2008, compared to $29.3 million for the same period in 2007.
Impairment of Acquired Intangible Assets: We incurred a $24.7 million non-cash pre-tax charge, or
approximately $0.46 per diluted share after tax, in 2008 for the write-down of acquired intangible assets related
to our acquisitions of the Pacific Trail and Montrail brands in 2006. The impairment charge related primarily to
goodwill and trademarks and resulted from our annual evaluation of intangible asset values. These brands have
not achieved our sales and profitability objectives and the deterioration in the macro-economic environment and
resulting effect on consumer demand decreased the probability of realizing these objectives in the near future.
Net Licensing Income: Net licensing income increased $0.8 million, or 15%, to $6.0 million in 2008 from
$5.2 million in 2007. In 2008, licensing income was led by Columbia-branded leather accessories, followed by
Columbia-branded socks, eyewear, insulated products including soft-sided coolers, and camping gear.
Interest Income, Net: Interest income was $7.6 million in 2008 compared to $9.0 million in 2007. The
decrease in interest income was primarily due to lower average investment yields compared with the same period
in 2007. Interest expense was nominal in 2008 and 2007.
Income Tax Expense: Our provision for income taxes decreased to $31.2 million in 2008 from $63.6
million in 2007. This decrease resulted from lower income before tax combined with a decrease in our effective
income tax rate to 24.7% in 2008 compared to 30.6% in 2007. The decrease in our tax rate resulted primarily
from generating a higher proportion of our income in foreign jurisdictions with lower overall tax rates, increased
foreign tax credits and the favorable conclusion of a European tax examination.
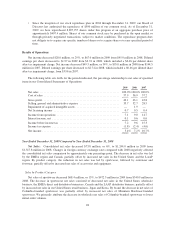
Liquidity and Capital Resources
Our primary ongoing funding requirements are for working capital, investing activities associated with the
expansion of our global operations and general corporate needs. At December 31, 2009, we had total cash and
cash equivalents of $386.7 million compared to $230.6 million at December 31, 2008. In addition, we had short-
term investments of $22.8 million at December 31, 2009 compared to $22.4 million at December 31, 2008.
Net cash provided by operating activities was $214.4 million in 2009 compared to $144.9 million in 2008.
The increase in cash provided by operating activities was primarily the result of significant reductions in
accounts receivable and inventory in 2009, partially offset by lower net income and a decrease in accounts
payable in 2009, and the non-cash pre-tax charge for the impairment of acquired intangible assets in 2008.
Net cash used in investing activities was $33.2 million in 2009 compared to net cash provided by investing
activities of $11.7 million in 2008. In 2009, our investing activities primarily consisted of capital expenditures of
$40.9 million, of which $7.8 million was incurred but not yet paid. Capital expenditures in 2009 consisted of
approximately $25.7 million related to retail expansion, including e-commerce in the United States and modest
investments in Korea and Japan, and approximately $15.2 million in maintenance and infrastructure projects. In
2008, our investing activities primarily consisted of net liquidation of short-term investments of $59.2 million
partially offset by capital expenditures of $54.3 million, of which $6.7 million was incurred but not yet paid.
Capital expenditures in 2008 consisted of approximately $12.8 million in maintenance capital expenditures and
$41.5 million for retail expansion and other capacity initiatives.
33