Columbia Sportswear 2009 Annual Report Download - page 31
Download and view the complete annual report
Please find page 31 of the 2009 Columbia Sportswear annual report below. You can navigate through the pages in the report by either clicking on the pages listed below, or by using the keyword search tool below to find specific information within the annual report.-
 1
1 -
2
-
3
-
4
-
5
-
6
-
7
-
8
-
9
-
10
-
11
-
12
-
13
-
14
-
15
-
16
-
17
-
18
-
19
-
20
-
 21
21 -
 22
22 -
 23
23 -
 24
24 -
 25
25 -
 26
26 -
 27
27 -
 28
28 -
 29
29 -
 30
30 -
 31
31 -
 32
32 -
 33
33 -
 34
34 -
 35
35 -
 36
36 -
 37
37 -
 38
38 -
 39
39 -
 40
40 -
 41
41 -
42
-
43
-
44
-
45
-
46
-
47
-
48
-
49
-
50
-
51
-
52
-
53
-
54
-
55
-
56
-
57
-
58
-
59
-
60
-
61
-
62
-
63
-
64
-
65
-
66
-
67
-
68
-
69
-
70
-
71
-
72
-
73
-
74
-
75
-
76
-
77
-
78
-
79
-
80
-
81
-
82
-
83
-
84
-
85
 |
 |

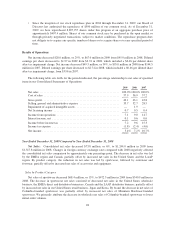
Item 6. SELECTED FINANCIAL DATA
Selected Consolidated Financial Data
The selected consolidated financial data presented below for, and as of the end of, each of the years in the
five-year period ended December 31, 2009 have been derived from our audited consolidated financial statements.
The consolidated financial data should be read in conjunction with the Consolidated Financial Statements and
Accompanying Notes that appear elsewhere in this annual report and Management’s Discussion and Analysis of
Financial Condition and Results of Operations set forth in Item 7.
Year Ended December 31,
2009 2008 2007 2006 2005 (1)
(In thousands, except per share amounts)
Statement of Operations Data:
Net sales ............................ $1,244,023 $1,317,835 $1,356,039 $1,287,672 $1,155,791
Net income .......................... 67,021 95,047 144,452 123,018 130,736
Per Share of Common Stock Data:
Earnings per share:
Basic ........................... $ 1.98 $ 2.75 $ 4.00 $ 3.39 $ 3.39
Diluted .......................... 1.97 2.74 3.96 3.36 3.36
Cash dividends per share ................ 0.66 0.64 0.58 0.14 —
Weighted average shares outstanding:
Basic ........................... 33,846 34,610 36,106 36,245 38,549
Diluted .......................... 33,981 34,711 36,434 36,644 38,943
December 31,
2009 2008 2007 2006 2005
Balance Sheet Data:
Total assets .......................... $1,212,883 $1,148,236 $1,166,481 $1,027,289 $ 967,640
Long-term obligations, net of current
maturities .......................... — 15 61 136 7,414
(1) Effective January 1, 2006, we adopted the fair value recognition provisions of Statement of Financial
Accounting Standards (“SFAS”) No. 123R, Share-Based Payment, which was codified into Topic 718 Stock
Compensation in the Accounting Standards Codification (“ASC”). Under this standard, compensation
expense is recognized in the Consolidated Statement of Operations for the fair value of employee stock-
based compensation. Prior to the adoption of this standard, we accounted for stock-based compensation
using the intrinsic value method, which results in no compensation expense recognized because the exercise
price of our employee stock options was equal to the market price of the underlying stock on the date of
grant. If we had applied the fair value recognition provisions of ASC Topic 718 to stock-based
compensation for the year ended December 31, 2005, net income would have been $122,513,000 and basic
and diluted earnings per share would have been $3.18 and $3.14, respectively.
24