Columbia Sportswear 2009 Annual Report Download - page 34
Download and view the complete annual report
Please find page 34 of the 2009 Columbia Sportswear annual report below. You can navigate through the pages in the report by either clicking on the pages listed below, or by using the keyword search tool below to find specific information within the annual report.-
 1
1 -
2
-
3
-
4
-
5
-
6
-
7
-
8
-
9
-
10
-
11
-
12
-
13
-
14
-
15
-
16
-
17
-
18
-
19
-
20
-
21
-
22
-
23
-
 24
24 -
 25
25 -
 26
26 -
 27
27 -
 28
28 -
 29
29 -
 30
30 -
 31
31 -
 32
32 -
 33
33 -
 34
34 -
 35
35 -
 36
36 -
 37
37 -
 38
38 -
 39
39 -
 40
40 -
 41
41 -
 42
42 -
 43
43 -
 44
44 -
45
-
46
-
47
-
48
-
49
-
50
-
51
-
52
-
53
-
54
-
55
-
56
-
57
-
58
-
59
-
60
-
61
-
62
-
63
-
64
-
65
-
66
-
67
-
68
-
69
-
70
-
71
-
72
-
73
-
74
-
75
-
76
-
77
-
78
-
79
-
80
-
81
-
82
-
83
-
84
-
85
 |
 |

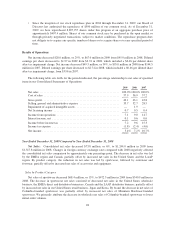
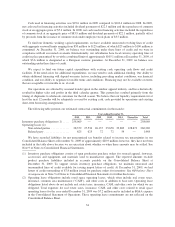
Year Ended December 31,
2009 2008 % Change
(In millions, except for percentage changes)
Geographical Net Sales to Unrelated Entities:
United States ..............................................$ 736.9 $ 727.7 1%
EMEA ................................................... 197.4 267.2 (26)%
LAAP .................................................... 203.2 198.2 3%
Canada ................................................... 106.5 124.7 (15)%
$1,244.0 $1,317.8 (6)%
Categorical Net Sales to Unrelated Entities:
Sportswear ................................................$ 472.5 $ 540.9 (13)%
Outerwear ................................................. 482.5 491.7 (2)%
Footwear ................................................. 214.6 217.2 (1)%
Accessories and Equipment ................................... 74.4 68.0 9%
$1,244.0 $1,317.8 (6)%
Brand Net Sales to Unrelated Entities:
Columbia .................................................$1,072.5 $1,162.0 (8)%
Mountain Hardwear ......................................... 100.5 95.0 6%
Sorel ..................................................... 60.6 48.1 26%
Other .................................................... 10.4 12.7 (18)%
$1,244.0 $1,317.8 (6)%
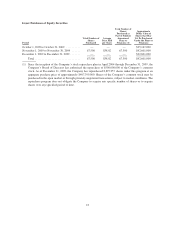
• Our wholesale backlog for the spring 2010 selling season as of September 30, 2009 decreased $20.1
million, or 5%, to $350.8 million from $370.9 million as of September 30, 2008, including a benefit of
approximately two percentage points from changes in foreign currency exchange rates compared with
2008. The decrease in our spring wholesale backlog consisted of a decline in orders from EMEA
distributors, our EMEA direct business and LAAP distributors, partially offset by an increase in orders
in Japan. Spring wholesale backlog for the United States and Canada was essentially flat compared to
2008. The decrease in orders, categorically, was driven primarily by a decline in orders of Columbia-
branded sportswear. Although we cannot predict with certainty any future results, our reported
wholesale backlog is one indicator of our anticipated wholesale net sales for the spring 2010 selling
season. Many factors, however, could cause actual sales to differ materially from reported wholesale
backlog, including the potential cancellation of orders by customers, which was significant for spring
2009 products, changes in the volume of closeout products sales, changes in foreign currency exchange
rates and macroeconomic conditions. In addition, we expect incremental sales through our
direct-to-consumer operations, which are not included in wholesale backlog, to affect actual sales
comparisons for the spring 2010 season. Our spring 2010 wholesale backlog should not be used as a sole
indicator of, or in forecasting, sales beyond the spring 2010 selling season.
• Gross profit decreased 100 basis points to 42.1% in 2009 from 43.1% in 2008. Gross profit margins
contracted primarily as a result of a higher volume of close-out product sales at lower gross margins and
unfavorable hedge rates.
• Selling, general and administrative expense increased $14.3 million, or 3%, to $444.7 million in 2009
from $430.4 million in 2008. This increase was primarily due to initial investment and incremental
operating costs in support of our direct-to-consumer initiatives and increased incentive compensation
and professional fees, partially offset by reduced advertising and bad debt expense.
• Net income decreased 29% to $67.0 million in 2009 from $95.0 million in 2008, and diluted earnings
per share decreased to $1.97 in 2009 compared to $2.74 in 2008, which included a $0.46 per diluted
share after-tax impairment charge. Net income in 2009 was unfavorably affected by lower revenues and
gross profit margins and increased selling, general and administrative expenses compared to 2008. Our
effective tax rate was 25.4% in 2009 compared to 24.7% in 2008.
27