Columbia Sportswear 2009 Annual Report Download - page 49
Download and view the complete annual report
Please find page 49 of the 2009 Columbia Sportswear annual report below. You can navigate through the pages in the report by either clicking on the pages listed below, or by using the keyword search tool below to find specific information within the annual report.-
 1
1 -
2
-
3
-
4
-
5
-
6
-
7
-
8
-
9
-
10
-
11
-
12
-
13
-
14
-
15
-
16
-
17
-
18
-
19
-
20
-
21
-
22
-
23
-
24
-
25
-
26
-
27
-
28
-
29
-
30
-
31
-
32
-
33
-
34
-
35
-
36
-
37
-
38
-
 39
39 -
 40
40 -
 41
41 -
 42
42 -
 43
43 -
 44
44 -
 45
45 -
 46
46 -
 47
47 -
 48
48 -
 49
49 -
 50
50 -
 51
51 -
 52
52 -
 53
53 -
 54
54 -
 55
55 -
 56
56 -
 57
57 -
 58
58 -
 59
59 -
60
-
61
-
62
-
63
-
64
-
65
-
66
-
67
-
68
-
69
-
70
-
71
-
72
-
73
-
74
-
75
-
76
-
77
-
78
-
79
-
80
-
81
-
82
-
83
-
84
-
85
 |
 |

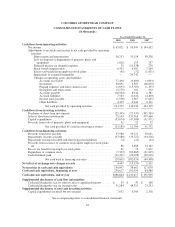
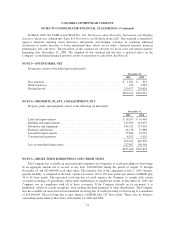
COLUMBIA SPORTSWEAR COMPANY
CONSOLIDATED STATEMENTS OF CASH FLOWS
(In thousands)
Year Ended December 31,
2009 2008 2007
Cash flows from operating activities:
Net income ................................................ $ 67,021 $ 95,047 $ 144,452
Adjustments to reconcile net income to net cash provided by operating
activities:
Depreciation and amortization ............................ 36,253 31,158 30,338
Loss on disposal or impairment of property, plant, and
equipment .......................................... 1,828 253 237
Deferred income tax (benefit) expense ...................... 55 (10,338) 278
Stock-based compensation ............................... 6,353 6,302 7,260
Excess tax benefit from employee stock plans ................ (41) (72) (1,811)
Impairment of acquired intangibles ......................... — 24,742 —
Changes in operating assets and liabilities:
Accounts receivable ................................. 77,490 (9,689) (3,093)
Inventories ........................................ 38,831 4,507 (46,010)
Prepaid expenses and other current assets ................ (1,695) (15,787) (1,355)
Intangibles and other assets ........................... (5,179) 101 592
Accounts payable ................................... (16,944) 8,944 1,381
Accrued liabilities .................................. 7,563 (1,047) (4,400)
Income taxes payable ................................ (1,558) 2,567 (5,665)
Other liabilities .................................... 4,395 8,242 2,111
Net cash provided by operating activities ............ 214,372 144,930 124,315
Cash flows from investing activities:
Purchases of short-term investments ............................ (25,305) (72,337) (305,769)
Sales of short-term investments ................................ 25,163 131,565 379,460
Capital expenditures ........................................ (33,074) (47,580) (31,971)
Proceeds from sale of property, plant, and equipment .............. 31 52 32
Net cash provided by (used in) investing activities ..... (33,185) 11,700 41,752
Cash flows from financing activities:
Proceeds from notes payable .................................. 57,588 33,727 30,651
Repayments on notes payable ................................. (57,588) (33,727) (34,276)
Repayment on long-term debt and other long-term liabilities ........ (4) (21) (22)
Proceeds from issuance of common stock under employee stock plans,
net .................................................... 86 3,488 14,162
Excess tax benefit from employee stock plans .................... 41 72 1,811
Repurchase of common stock ................................. (7,399) (83,865) (31,819)
Cash dividends paid ......................................... (22,331) (22,098) (20,915)
Net cash used in financing activities ................ (29,607) (102,424) (40,408)
Net effect of exchange rate changes on cash ........................ 4,467 (15,539) 1,411
Net increase in cash and cash equivalents .......................... 156,047 38,667 127,070
Cash and cash equivalents, beginning of year ...................... 230,617 191,950 64,880
Cash and cash equivalents, end of year ............................ $386,664 $ 230,617 $ 191,950
Supplemental disclosures of cash flow information:
Cash paid during the year for interest, net of capitalized interest ...... $ 35 $ 47 $ 148
Cash paid during the year for income taxes ...................... 31,284 48,521 73,293
Supplemental disclosures of non-cash investing activities:
Capital expenditures incurred but not yet paid .................... 7,852 6,760 2,318
See accompanying notes to consolidated financial statements.
42