Columbia Sportswear 2009 Annual Report Download - page 38
Download and view the complete annual report
Please find page 38 of the 2009 Columbia Sportswear annual report below. You can navigate through the pages in the report by either clicking on the pages listed below, or by using the keyword search tool below to find specific information within the annual report.-
 1
1 -
2
-
3
-
4
-
5
-
6
-
7
-
8
-
9
-
10
-
11
-
12
-
13
-
14
-
15
-
16
-
17
-
18
-
19
-
20
-
21
-
22
-
23
-
24
-
25
-
26
-
27
-
 28
28 -
 29
29 -
 30
30 -
 31
31 -
 32
32 -
 33
33 -
 34
34 -
 35
35 -
 36
36 -
 37
37 -
 38
38 -
 39
39 -
 40
40 -
 41
41 -
 42
42 -
 43
43 -
 44
44 -
 45
45 -
 46
46 -
 47
47 -
 48
48 -
49
-
50
-
51
-
52
-
53
-
54
-
55
-
56
-
57
-
58
-
59
-
60
-
61
-
62
-
63
-
64
-
65
-
66
-
67
-
68
-
69
-
70
-
71
-
72
-
73
-
74
-
75
-
76
-
77
-
78
-
79
-
80
-
81
-
82
-
83
-
84
-
85
 |
 |
licensing in the LAAP region. Products distributed by our licensees in 2009 included apparel, footwear, leather
accessories, eyewear, socks, insulated products including soft-sided coolers, camping gear, bicycles, home
products, luggage, watches and other accessories.
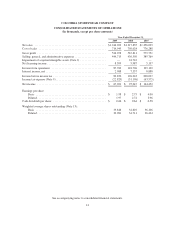
Interest Income, Net: Interest income was $2.1 million in 2009 compared to $7.6 million in 2008. The
decrease in interest income was almost entirely due to significantly lower interest rates in 2009 compared to
2008. Interest expense was nominal in 2009 and 2008.
Income Tax Expense: Our provision for income taxes decreased to $22.8 million in 2009 from $31.2
million in 2008. This decrease resulted from lower income before tax, partially offset by an increase in our
effective income tax rate to 25.4% in 2009 compared to 24.7% in 2008. Our 2009 effective tax rate varied from
the U.S. statutory rate due to foreign tax credits and the favorable settlement of uncertain tax positions.
Year Ended December 31, 2008 Compared to Year Ended December 31, 2007
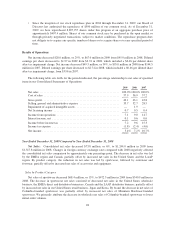
Net Sales: Consolidated net sales decreased $38.2 million, or 3%, to $1,317.8 million in 2008 from
$1,356.0 million in 2007. Changes in foreign currency exchange rates compared to 2007 contributed one
percentage point of benefit to the consolidated net sales comparison. The decrease in net sales was led by the
United States, followed by the EMEA region and Canada, partially offset by increased net sales in the LAAP
region. By product category, the reduction in net sales was led by sportswear, followed by footwear and
outerwear, partially offset by increased net sales of accessories and equipment.
Sales by Product Category
Net sales of sportswear decreased $24.7 million, or 4%, to $540.9 million in 2008 from $565.6 million in
2007. The decrease in sportswear net sales was predominantly the result of decreased net sales in the United
States, followed by the EMEA region, offset by increased net sales in the LAAP region and Canada. The
sportswear net sales decrease was led by the United States wholesale business for the Columbia brand, partially
offset by incremental net sales through our expanded base of branded and outlet retail stores. We primarily
attribute the decrease in wholesale net sales of sportswear to the lower initial order volumes and the weak U.S.
retail environment resulting from difficult macro-economic conditions.
Net sales of outerwear decreased $5.9 million, or 1%, to $491.7 million in 2008 from $497.6 million in
2007. The decrease in outerwear net sales was led by the United States, followed by the EMEA region and
Canada, partially offset by an increase in the LAAP region. The decrease in outerwear net sales was
predominantly the result of decreased sales of the Columbia brand in the United States wholesale and EMEA
direct businesses. The decrease in both regions was primarily the result of lower initial order volumes for the
spring and fall 2008 seasons as well as the weak retail environment resulting from difficult macro-economic
conditions. The decrease in sales of Columbia-branded outerwear was partially offset by increased sales of
Mountain Hardwear-branded outerwear.
Net sales of footwear decreased $10.2 million, or 4%, to $217.2 million in 2008 from $227.4 million in
2007. The decrease in footwear net sales was led by the EMEA region, followed by Canada, partially offset by
increased net sales of footwear in the LAAP region and the United States. The decrease in footwear net sales in
the EMEA region was led by EMEA direct footwear net sales, followed by EMEA distributor net sales. The
decrease in EMEA direct footwear net sales was primarily the result of lower initial order volumes due to
continued product assortment and marketing challenges, coupled with economic uncertainty in that region. The
decrease in EMEA distributor footwear net sales was primarily a result of earlier shipments of spring 2008
product that occurred in the fourth quarter of 2007.
Net sales of accessories and equipment increased $2.6 million, or 4%, to $68.0 million in 2008 from $65.4
million in 2007. Accessories and equipment sales growth was led by the LAAP region, followed by Canada,
partially offset by a decrease in net sales in the United States, while net sales of accessories and equipment
remained flat in the EMEA region.
31