Columbia Sportswear 2009 Annual Report Download - page 39
Download and view the complete annual report
Please find page 39 of the 2009 Columbia Sportswear annual report below. You can navigate through the pages in the report by either clicking on the pages listed below, or by using the keyword search tool below to find specific information within the annual report.Sales by Geographic Region
Net sales in the United States decreased $39.5 million, or 5%, to $727.7 million in 2008 from $767.2 million
in 2007. The reduction in net sales in the United States was led by sportswear, followed by outerwear and
accessories and equipment, while sales of footwear remained essentially flat. The net sales decrease was led by
the wholesale business for the Columbia brand, partially offset by increased net sales through our expanded base
of branded and outlet retail stores. During 2008 we opened 15 new outlet retail stores and 5 branded retail stores
in the United States, ending the year with 28 outlet retail stores and 6 branded retail stores in the United States.
Net sales in the EMEA region decreased $19.8 million, or 7%, to $267.2 million in 2008 from $287.0
million in 2007. Changes in foreign currency exchange rates contributed five percentage points of benefit to
EMEA net sales compared to 2007. The decrease in net sales in the EMEA region was led by footwear, followed
by outerwear and sportswear, while net sales of accessories and equipment remained essentially flat. The
decrease in net sales in the EMEA region included a decrease in EMEA direct net sales, partially offset by an
increase in net sales to EMEA distributors. The decrease in EMEA direct net sales was the result of lower initial
order volumes for the spring and fall 2008 seasons due to continued product assortment and marketing
challenges, coupled with economic uncertainty in the region. The increase in net sales to EMEA distributors
primarily reflects increased Columbia-branded outerwear and sportswear net sales to our largest distributor in the
region.
Net sales in the LAAP region increased $22.5 million, or 13%, to $198.2 million in 2008 from $175.7
million in 2007. Changes in foreign currency exchange rates contributed less than one percentage point of benefit
to LAAP net sales compared to 2007. Sales growth in the LAAP region was led by our Japan business, which
benefited from foreign currency exchange rates, followed by our LAAP distributor business, while net sales in
Korea remained essentially flat, including a negative impact from foreign currency exchange rates. The increase
in Japan net sales was primarily the result of growth in our retail business as well as continued expansion with
key wholesale partners, particularly in the sports chain channel.
Net sales in Canada decreased $1.4 million, or 1%, to $124.7 million in 2008 from $126.1 million in 2007.
Changes in foreign currency exchange rates contributed two percentage points of benefit to Canada net sales
compared to 2007. The decrease in net sales in Canada was led by outerwear, followed by footwear, partially
offset by increased net sales of sportswear and accessories and equipment. The decrease in outerwear was
primarily attributable to lower initial order volumes of Columbia-branded products for the fall 2008 season,
partially offset by incremental sales of Mountain Hardwear-branded products that were previously sold through
third party distributors.
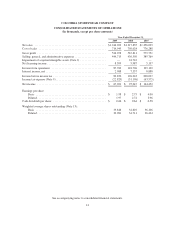
Gross Profit: Gross profit as a percentage of net sales increased to 43.1% in 2008 from 42.8% in 2007.
Gross profit margins expanded in all of our product categories primarily due to a lower volume of close-out
product sales and an increase in average selling prices, partially offset by the negative effects of an increased mix
of sales to distributors, which carry lower margins than wholesale customers, and the effects of changes in
foreign currency exchange rates.
A decrease in 2008 close-out product sales at slightly lower gross margins compared to 2007 had a
favorable affect on our consolidated gross profits. We primarily attribute this decrease to earlier close-out sales
of fall 2007 product in the fourth quarter of 2007.
Selling, General and Administrative Expense: SG&A expense increased $44.6 million, or 12%, to $430.4
million in 2008 from $385.8 million in 2007. Selling expenses increased $8.2 million, or 7%, while general and
administrative expenses increased $36.4 million, or 13%. As a percentage of net sales, SG&A expense increased
to 32.7% of net sales in 2008 from 28.5% of net sales in 2007.
32


