Columbia Sportswear 2009 Annual Report Download - page 37
Download and view the complete annual report
Please find page 37 of the 2009 Columbia Sportswear annual report below. You can navigate through the pages in the report by either clicking on the pages listed below, or by using the keyword search tool below to find specific information within the annual report.-
 1
1 -
2
-
3
-
4
-
5
-
6
-
7
-
8
-
9
-
10
-
11
-
12
-
13
-
14
-
15
-
16
-
17
-
18
-
19
-
20
-
21
-
22
-
23
-
24
-
25
-
26
-
 27
27 -
 28
28 -
 29
29 -
 30
30 -
 31
31 -
 32
32 -
 33
33 -
 34
34 -
 35
35 -
 36
36 -
 37
37 -
 38
38 -
 39
39 -
 40
40 -
 41
41 -
 42
42 -
 43
43 -
 44
44 -
 45
45 -
 46
46 -
 47
47 -
48
-
49
-
50
-
51
-
52
-
53
-
54
-
55
-
56
-
57
-
58
-
59
-
60
-
61
-
62
-
63
-
64
-
65
-
66
-
67
-
68
-
69
-
70
-
71
-
72
-
73
-
74
-
75
-
76
-
77
-
78
-
79
-
80
-
81
-
82
-
83
-
84
-
85
 |
 |
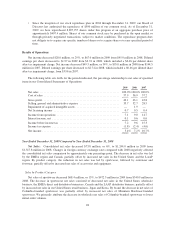
Net sales in Canada decreased $18.2 million, or 15%, to $106.5 million in 2009 from $124.7 million in
2008. Changes in foreign currency exchange rates compared to 2008 negatively affected the net sales comparison
by seven percentage points. The decrease in net sales in Canada was led by sportswear and outerwear, partially
offset by increased net sales of footwear and accessories and equipment. The decrease in net sales was consistent
with lower advance order volumes of Columbia-branded products due in part to planned reductions in certain
channels of distribution.
Gross Profit: Gross profit as a percentage of net sales decreased to 42.1% in 2009 from 43.1% in 2008.
Gross profit margins contracted primarily as a result of a higher volume of close-out product sales at lower gross
margins and unfavorable hedge rates.
Our gross profits may not be comparable to those of other companies in our industry because some include
all of the costs related to their distribution network in cost of sales. We, like others, have chosen to include these
expenses as a component of selling, general and administrative expense.
Selling, General and Administrative Expense: Selling, general and administrative expense (“SG&A”)
includes all costs associated with our design, merchandising, marketing, selling, distribution and corporate
functions, including related depreciation and amortization.
SG&A expense increased $14.3 million, or 3%, to $444.7 million in 2009 from $430.4 million in 2008. As a
percentage of net sales, SG&A expense increased to 35.7% of net sales in 2009 from 32.7% of net sales in 2008.
The increase in SG&A expense as a percentage of net sales was largely the result of reduced net sales in our
wholesale business coupled with an increased fixed cost base related to our expanding direct-to-consumer
operations and increased incentive compensation and professional fees, partially offset by reduced advertising
and bad debt expense.
Selling expenses, including commissions and advertising, decreased $17.0 million, or 14%, to 8.4% of net
sales in 2009 from 9.2% of net sales in 2008. We attribute the decrease in selling expenses as a percentage of net
sales to lower commission expense as relationships with certain independent sales agencies in the United States
and the EMEA region have been discontinued and replaced by in-house sales operations. Operating expenses for
the in-house sales organization are included in general and administrative expenses.
General and administrative expenses increased $31.3 million, or 10%, to 27.4% of net sales in 2009 from
23.4% of net sales for the comparable period in 2008. The increase in general and administrative expenses as a
percentage of net sales was primarily due to incremental operating costs in support our direct-to-consumer
initiatives and the expansion of our in-house sales organization, partially offset by lower bad debt expense.
Depreciation and amortization included in SG&A expense totaled $35.5 million for 2009, compared to $30.1
million for the same period in 2008.
Impairment of Acquired Intangible Assets: We did not incur any impairment of acquired intangible
assets in 2009. During the fourth quarter of 2008, we incurred a $24.7 million non-cash pre-tax charge, or
approximately $0.46 per diluted share after tax, for the write-down of acquired intangible assets related to our
acquisitions of the Pacific Trail and Montrail brands in 2006. The impairment charge related primarily to
goodwill and trademarks and resulted from our annual evaluation of intangible asset values. These brands had not
achieved our sales and profitability objectives and the deterioration in the macro-economic environment and
resulting effect on consumer demand have decreased the probability of realizing these objectives in the near
future. We remain committed to marketing and distributing Montrail-branded footwear through the outdoor
specialty, running specialty and sporting goods channels. Beginning in 2009, Pacific Trail products are sold
primarily through licensing arrangements.
Net Licensing Income: Net licensing income increased $2.4 million, or 40%, to $8.4 million in 2009 from
$6.0 million in 2008. The increase in net licensing income was primarily due to increased apparel and footwear
30