Columbia Sportswear 2009 Annual Report Download - page 35
Download and view the complete annual report
Please find page 35 of the 2009 Columbia Sportswear annual report below. You can navigate through the pages in the report by either clicking on the pages listed below, or by using the keyword search tool below to find specific information within the annual report.-
 1
1 -
2
-
3
-
4
-
5
-
6
-
7
-
8
-
9
-
10
-
11
-
12
-
13
-
14
-
15
-
16
-
17
-
18
-
19
-
20
-
21
-
22
-
23
-
24
-
 25
25 -
 26
26 -
 27
27 -
 28
28 -
 29
29 -
 30
30 -
 31
31 -
 32
32 -
 33
33 -
 34
34 -
 35
35 -
 36
36 -
 37
37 -
 38
38 -
 39
39 -
 40
40 -
 41
41 -
 42
42 -
 43
43 -
 44
44 -
 45
45 -
46
-
47
-
48
-
49
-
50
-
51
-
52
-
53
-
54
-
55
-
56
-
57
-
58
-
59
-
60
-
61
-
62
-
63
-
64
-
65
-
66
-
67
-
68
-
69
-
70
-
71
-
72
-
73
-
74
-
75
-
76
-
77
-
78
-
79
-
80
-
81
-
82
-
83
-
84
-
85
 |
 |

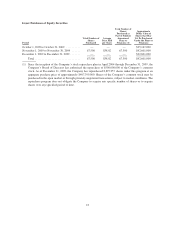
• Since the inception of our stock repurchase plan in 2004 through December 31, 2009, our Board of
Directors has authorized the repurchase of $500 million of our common stock. As of December 31,
2009, we have repurchased 8,897,957 shares under this program at an aggregate purchase price of
approximately $407.4 million. Shares of our common stock may be purchased in the open market or
through privately negotiated transactions, subject to market conditions. The repurchase program does
not obligate us to acquire any specific number of shares or to acquire shares over any specified period of
time.
Results of Operations
Net income decreased $28.0 million, or 29%, to $67.0 million in 2009 from $95.0 million in 2008. Diluted
earnings per share decreased to $1.97 in 2009 from $2.74 in 2008, which included a $0.46 per diluted share
after-tax impairment charge. Net income decreased $49.5 million, or 34%, to $95.0 million in 2008 from $144.5
million in 2007. Diluted earnings per share decreased to $2.74 in 2008, which included a $0.46 per diluted share
after-tax impairment charge, from $3.96 in 2007.
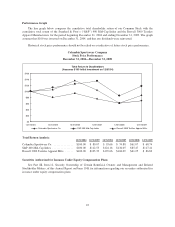
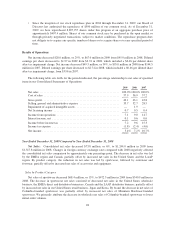
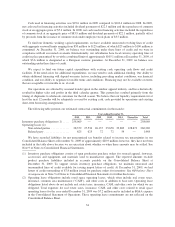
The following table sets forth, for the periods indicated, the percentage relationship to net sales of specified
items in our Consolidated Statements of Operations:
2009 2008 2007
Net sales ........................................................ 100.0% 100.0% 100.0%
Cost of sales ..................................................... 57.9 56.9 57.2
Gross profit ...................................................... 42.1 43.1 42.8
Selling, general and administrative expense ............................ 35.7 32.7 28.5
Impairment of acquired intangible assets ............................... — 1.9 —
Net licensing income .............................................. 0.7 0.5 0.4
Income from operations ............................................ 7.1 9.0 14.7
Interest income, net ............................................... 0.1 0.6 0.6
Income before income tax .......................................... 7.2 9.6 15.3
Income tax expense ............................................... (1.8) (2.4) (4.6)
Net income ...................................................... 5.4% 7.2% 10.7%
Year Ended December 31, 2009 Compared to Year Ended December 31, 2008
Net Sales: Consolidated net sales decreased $73.8 million, or 6%, to $1,244.0 million in 2009 from
$1,317.8 million in 2008. Changes in foreign currency exchange rates compared with 2008 negatively affected
the consolidated net sales comparison by approximately one percentage point. The decrease in net sales was led
by the EMEA region and Canada, partially offset by increased net sales in the United States and the LAAP
region. By product category, the reduction in net sales was led by sportswear, followed by outerwear and
footwear, partially offset by increased net sales of accessories and equipment.
Sales by Product Category
Net sales of sportswear decreased $68.4 million, or 13%, to $472.5 million in 2009 from $540.9 million in
2008. The decrease in sportswear net sales consisted of decreased net sales in the United States wholesale
business, the EMEA direct and distributor businesses, Canada and the LAAP distributor business, partially offset
by increased net sales in our United States retail business, Japan and Korea. By brand, the decrease in net sales of
Columbia-branded sportswear was partially offset by increased net sales of Mountain Hardwear-branded
sportswear. We primarily attribute the decrease in wholesale net sales of Columbia-branded sportswear to lower
initial order volumes.
28