Cisco 2005 Annual Report Download - page 67
Download and view the complete annual report
Please find page 67 of the 2005 Cisco annual report below. You can navigate through the pages in the report by either clicking on the pages listed below, or by using the keyword search tool below to find specific information within the annual report.-
 1
1 -
2
-
3
-
4
-
5
-
6
-
7
-
8
-
9
-
10
-
11
-
12
-
13
-
14
-
15
-
16
-
17
-
18
-
19
-
20
-
21
-
22
-
23
-
24
-
25
-
26
-
27
-
28
-
29
-
30
-
31
-
32
-
33
-
34
-
35
-
36
-
37
-
38
-
39
-
40
-
41
-
42
-
43
-
44
-
45
-
46
-
47
-
48
-
49
-
50
-
51
-
52
-
53
-
54
-
55
-
56
-
 57
57 -
 58
58 -
 59
59 -
 60
60 -
 61
61 -
 62
62 -
 63
63 -
 64
64 -
 65
65 -
 66
66 -
 67
67 -
 68
68 -
 69
69 -
 70
70 -
 71
71
 |
 |

70
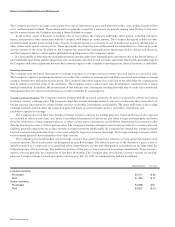
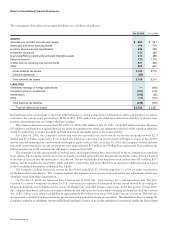
The majority of the Company’s assets as of July 30, 2005 and July 31, 2004 were attributable to its U.S. operations. In fiscal 2005,
2004, and 2003, no single customer accounted for 10% or more of the Company’s net sales.
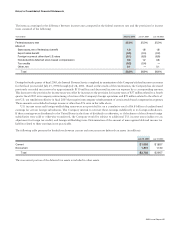
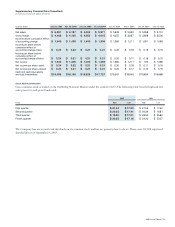
Property and equipment information is based on the physical location of the assets. The following table presents property and equipment
information for geographic areas (in millions):
July 30, 2005
$ 2,959
361
$ 3,320
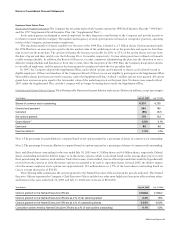
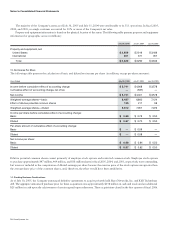
13. Net Income Per Share
The following table presents the calculation of basic and diluted net income per share (in millions, except per-share amounts):
July 30, 2005
$ 5,741
—
$ 5,741
6,487
125
6,612
$ 0.88
$ 0.87
$ —
$ —
$ 0.88
$ 0.87
Dilutive potential common shares consist primarily of employee stock options and restricted common stock. Employee stock options
to purchase approximately 847 million, 469 million, and 838 million shares in fiscal 2005, 2004, and 2003, respectively, were outstanding,
but were not included in the computation of diluted earnings per share because the exercise price of the stock options was greater than
the average share price of the common shares, and, therefore, the effect would have been antidilutive.
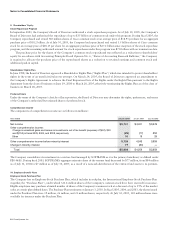
14. Pending Business Combinations
As of July 30, 2005, the Company announced definitive agreements to acquire privately held Sheer Networks, Inc. and KiSS Technology
A/S. The aggregate announced purchase price for these acquisitions was approximately $158 million in cash and stock and an additional
$25 million in cash upon the achievement of certain agreed-upon milestones. These acquisitions closed in the first quarter of fiscal 2006.
Notes to Consolidated Financial Statements