Cisco 2005 Annual Report Download - page 23
Download and view the complete annual report
Please find page 23 of the 2005 Cisco annual report below. You can navigate through the pages in the report by either clicking on the pages listed below, or by using the keyword search tool below to find specific information within the annual report.-
 1
1 -
2
-
3
-
4
-
5
-
6
-
7
-
8
-
9
-
10
-
11
-
12
-
 13
13 -
 14
14 -
 15
15 -
 16
16 -
 17
17 -
 18
18 -
 19
19 -
 20
20 -
 21
21 -
 22
22 -
 23
23 -
 24
24 -
 25
25 -
 26
26 -
 27
27 -
 28
28 -
 29
29 -
 30
30 -
 31
31 -
 32
32 -
 33
33 -
34
-
35
-
36
-
37
-
38
-
39
-
40
-
41
-
42
-
43
-
44
-
45
-
46
-
47
-
48
-
49
-
50
-
51
-
52
-
53
-
54
-
55
-
56
-
57
-
58
-
59
-
60
-
61
-
62
-
63
-
64
-
65
-
66
-
67
-
68
-
69
-
70
-
71
 |
 |

26
Factors That May Impact Net Product Sales Net product sales may continue to be affected by changes in the geopolitical environment and
global economic conditions; competition, including price-focused competitors from Asia, especially China; new product introductions;
sales cycles and product implementation cycles; changes in the mix of our customers between service provider and enterprise markets;
changes in the mix of direct sales and indirect sales; variations in sales channels; and final acceptance criteria of the product, system,
or solution as specified by the customer. In addition, sales to the service provider market have been characterized by large and often
sporadic purchases, especially relating to our router sales and sales of certain of our advanced technologies. In addition, service
provider customers typically have longer implementation cycles, require a broader range of services including network design services,
and often have acceptance provisions that can lead to a delay in revenue recognition. To improve customer satisfaction, we continue
to focus on managing our manufacturing lead-time performance, which may result in corresponding reductions in order backlog.
A decline in backlog levels could result in more variability and less predictability in our quarter-to-quarter net sales and operating
results. Net product sales may also be adversely affected by fluctuations in demand for our products, especially with respect to Internet
businesses and telecommunications service providers, price and product competition in the communications and networking
industries, introduction and market acceptance of new technologies and products, adoption of new networking standards, and
financial difficulties experienced by our customers. We may, from time to time, experience manufacturing issues that create a delay
in our suppliers’ ability to provide specific components, resulting in delayed shipments. To the extent that manufacturing issues and
any related component shortages result in delayed shipments in the future, and particularly in periods when we and our suppliers
are operating at higher levels of capacity, it is possible that revenue for a quarter could be adversely affected if such matters are not
remediated within the same quarter.
Our distributors and retail partners participate in various cooperative marketing and other programs. In addition, increasing
sales to our distributors and retail partners generally results in greater difficulty in forecasting the mix of our products and, to a
certain degree, the timing of orders from our customers. We recognize revenue to our distributors and retail partners based on a
sell-through method using information provided by them, and we maintain estimated accruals and allowances for all cooperative
marketing and other programs.
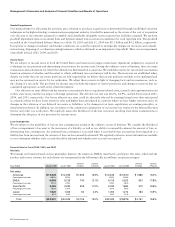
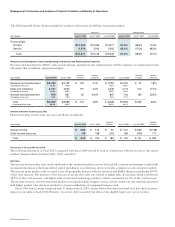
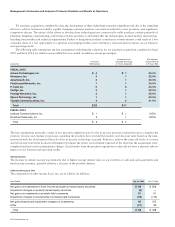
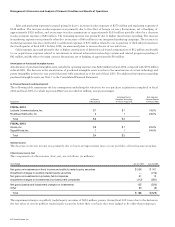
Net Service Revenue
The increase in net service revenue was primarily due to increased technical support service contract initiations and renewals associated
with higher product sales that have resulted in a larger installed base of equipment being serviced and revenue from advanced services,
which relates to consulting support services of our technologies for specific networking needs.
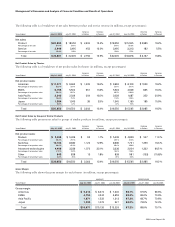
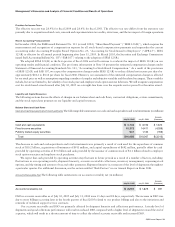
Product Gross Margin
Product gross margin percentage decreased by 1.3%. Changes in the mix of products sold decreased product gross margin by
approximately 2.5% due to higher sales of certain lower-margin switching products and increased sales of home networking
products. Product pricing reductions and sales discounts decreased product gross margin by approximately 2%. In addition, a higher
provision for warranty and a higher provision for inventory decreased product gross margin by approximately 0.5%. However, lower
overall manufacturing costs related to lower component costs and value engineering and other manufacturing-related costs increased
product gross margin by approximately 2%. Value engineering is the process by which the production costs are reduced through
component redesign, board configuration, test processes, and transformation processes. Higher shipment volumes also increased
product gross margin by approximately 1.5%.
Product gross margin may continue to be adversely affected in the future by: changes in the mix of products sold, including
further periods of increased growth of some of our lower-margin products; introduction of new products, including products with
price-performance advantages; our ability to reduce production costs; entry into new markets, including markets with different
pricing and cost structures; changes in distribution channels; price competition, including competitors from Asia and especially China;
changes in geographic mix; sales discounts; increases in material or labor costs; excess inventory and obsolescence charges; warranty
costs; changes in shipment volume; loss of cost savings due to changes in component pricing; impact of value engineering; inventory
holding charges; and how well we execute on our strategic and operating plans.
Management’s Discussion and Analysis of Financial Condition and Results of Operations