Cisco 2005 Annual Report Download - page 10
Download and view the complete annual report
Please find page 10 of the 2005 Cisco annual report below. You can navigate through the pages in the report by either clicking on the pages listed below, or by using the keyword search tool below to find specific information within the annual report.-
 1
1 -
 2
2 -
 3
3 -
 4
4 -
 5
5 -
 6
6 -
 7
7 -
 8
8 -
 9
9 -
 10
10 -
 11
11 -
 12
12 -
 13
13 -
 14
14 -
 15
15 -
 16
16 -
 17
17 -
 18
18 -
 19
19 -
 20
20 -
 21
21 -
22
-
23
-
24
-
25
-
26
-
27
-
28
-
29
-
30
-
31
-
32
-
33
-
34
-
35
-
36
-
37
-
38
-
39
-
40
-
41
-
42
-
43
-
44
-
45
-
46
-
47
-
48
-
49
-
50
-
51
-
52
-
53
-
54
-
55
-
56
-
57
-
58
-
59
-
60
-
61
-
62
-
63
-
64
-
65
-
66
-
67
-
68
-
69
-
70
-
71
 |
 |

13
Fiscal 2005 was a year of continued solid, balanced growth
for Cisco from both a product- and market-leadership per-
spective. We achieved an outstanding nancial performance
with record prots and cash generation, year-over-year
growth in our core routing and switching products, and
very strong growth in our six advanced technologies. Our
enterprise, service provider, and commercial customer mar-
ket segments all experienced solid year-over-year growth.
However, the highlight for the year was the balance that we
achieved across our geographies, customer market seg-
ments, architectural evolutions, and product families. We
believe our nancial strength, product leadership, and global
reach uniquely position Cisco as a company not only built to
last, but built to lead.
Innovation Strategy
In our opinion, the key to long-term suc-
cess in the high-technology industry
is ongoing strategic investment and
innovation, and we intend to continue to
take good business risks. Our innovation
strategy requires a unique combination
of internal development, partnerships,
and acquisitions. In our opinion, for
companies to lead in the technology
industry they must be able to do all
three. We continue to believe that our
industry will consolidate and that the
consolidation will occur along both
technology and business architecture
lines. This technology architecture will
probably evolve where the seven layers
of the Open Systems Interconnection
(OSI) stack are rst loosely, then tightly
coupled. That is exactly where you see
us taking the integration of our core and
advanced technology product archi-
tectures. Equally important, companies
also have to gain the condence of their
customers from a vision and strategy perspective, a product
architecture leadership perspective, and a service and sup-
port perspective. We think we are very uniquely positioned
to continue to win the hearts, minds, and capital investments
of our customers.
In scal 2005 we invested more than $3.3 billion in research
and development (R&D). This resulted in more than 50 product
introductions and the number-one market share leadership
position in most of our product categories, including our
advanced technology markets, truly demonstrating that the
investments we made three to ve years ago are now paying
off. We believe this product momentum will continue in scal
2006, and we will do our best to continue to meet and exceed
the expectations of our customers and partners.
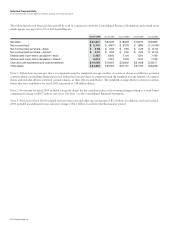
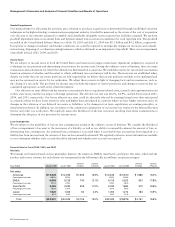
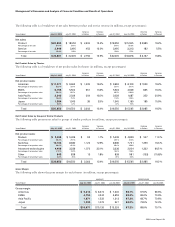
Fiscal 2005 Performance
In scal 2005 we achieved record performance across
almost all of our nancial and operational metrics. Fiscal 2005
revenue was $24.8 billion, compared to scal 2004 revenue
of $22.0 billion. Net income on a generally accepted account-
ing principles (GAAP) basis was $5.7 billion, compared to
scal 2004 GAAP net income of $4.4 billion. GAAP earnings
per share on a fully diluted basis for scal 2005 were $0.87,
compared to $0.62 for scal 2004. In
addition to net income, Cisco gener-
ated $7.6 billion in cash, highlighting the
ongoing quality of our earnings.
Cisco demonstrated solid execution on
its three long-term nancial priorities.
First, we continued to focus on prot-
able growth with GAAP net income as
a percentage of revenue exceeding
20 percent. During scal 2005, we in-
creased revenue year over year by
approximately 12.5 percent. Of total
revenue, approximately $20.9 billion was
related to product revenue and $3.9
billion was related to service revenue.
Our revenue growth is the result of a
continued recovery in the global IT eco-
nomic environment, and we achieved
signicant market share gains in many
product areas.
Second, we increased our protability.
We increased GAAP net income by 30
percent and GAAP earnings per share
by 40 percent during scal 2005, while
operating expenses decreased by 3
percent as a percentage of revenue.
A key competitive advantage for Cisco is how we use our own
technology to drive productivity. We achieved a key metric
by reaching our productivity goal of approximately $700,000
in annualized revenue per employee, up from approximately
$450,000 in scal 2001 when the goal was set. This is signi-
cant given that we also increased headcount in scal 2005
by 12 percent, primarily in sales and R&D. Our protability far
exceeded our revenue growth rate and is evidence of our
ability to drive productivity and operational efciency.