Cisco 2005 Annual Report Download - page 21
Download and view the complete annual report
Please find page 21 of the 2005 Cisco annual report below. You can navigate through the pages in the report by either clicking on the pages listed below, or by using the keyword search tool below to find specific information within the annual report.-
 1
1 -
2
-
3
-
4
-
5
-
6
-
7
-
8
-
9
-
10
-
 11
11 -
 12
12 -
 13
13 -
 14
14 -
 15
15 -
 16
16 -
 17
17 -
 18
18 -
 19
19 -
 20
20 -
 21
21 -
 22
22 -
 23
23 -
 24
24 -
 25
25 -
 26
26 -
 27
27 -
 28
28 -
 29
29 -
 30
30 -
 31
31 -
32
-
33
-
34
-
35
-
36
-
37
-
38
-
39
-
40
-
41
-
42
-
43
-
44
-
45
-
46
-
47
-
48
-
49
-
50
-
51
-
52
-
53
-
54
-
55
-
56
-
57
-
58
-
59
-
60
-
61
-
62
-
63
-
64
-
65
-
66
-
67
-
68
-
69
-
70
-
71
 |
 |

24
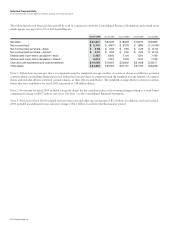
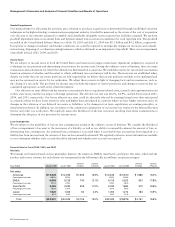
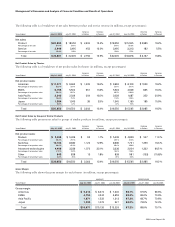
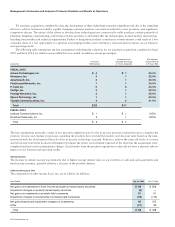
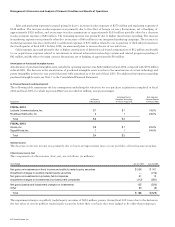
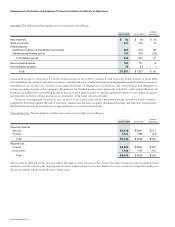
The following table shows the gross margin for products and services (in millions, except percentages):
July 30, 2005 July 30, 2005
$ 14,095 67.6%
2,576 65.2%
$ 16,671 67.2%
Research and Development, Sales and Marketing, and General and Administrative Expenses
Research and development (R&D), sales and marketing, and general and administrative (G&A) expenses are summarized in the
following table (in millions, except percentages):
July 30,2005
$ 3,322
Percentage of net sales 13.4% 14.5% 14.5% 16.6%
4,721
Percentage of net sales 19.0% 20.6% 20.6% 21.8%
959
Percentage of net sales 3.9% 3.9% 3.9% 3.7%
$ 9,002
Percentage of net sales 36.3% 39.0% 39.0% 42.1%
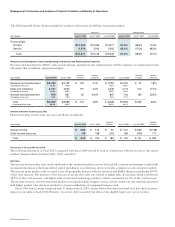
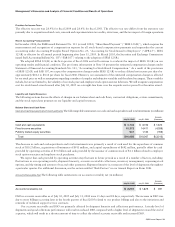
Interest and Other Income (Loss), Net
Interest and other income (loss), net, were as follows (in millions):
July 30, 2005
$ 552
68
$ 620
Discussion of Fiscal 2005 and 2004
The following discussion of fiscal 2005 compared with fiscal 2004 should be read in conjunction with the section of this report
entitled “Financial Data for Fiscal 2005, 2004, and 2003.”
Net Sales
The increase in net product sales can be attributed to the continued gradual recovery in the global economic environment coupled with
increased information technology-related capital spending in our enterprise, service provider, commercial, and consumer markets.
The increase in net product sales occurred across all geographic theaters, with the Americas and EMEA theaters contributing 89.4%
of the total increase. The majority of the increase in net product sales was related to higher sales of switches, which contributed
48.8% of the total increase, and higher sales of advanced technology products, which contributed 46.5% of the total increase.
The increase in service revenue was primarily due to increased technical support service contract initiations and renewals associated
with higher product sales that have resulted in a larger installed base of equipment being serviced.
Fiscal 2005 had 52 weeks compared with 53 weeks in fiscal 2004, and we believe that this extra week may have had a positive
impact on our sales in fiscal 2004. However, we are not able to quantify the effect of the slightly longer year on our revenue.
Management’s Discussion and Analysis of Financial Condition and Results of Operations