Cisco 2005 Annual Report Download - page 61
Download and view the complete annual report
Please find page 61 of the 2005 Cisco annual report below. You can navigate through the pages in the report by either clicking on the pages listed below, or by using the keyword search tool below to find specific information within the annual report.-
 1
1 -
2
-
3
-
4
-
5
-
6
-
7
-
8
-
9
-
10
-
11
-
12
-
13
-
14
-
15
-
16
-
17
-
18
-
19
-
20
-
21
-
22
-
23
-
24
-
25
-
26
-
27
-
28
-
29
-
30
-
31
-
32
-
33
-
34
-
35
-
36
-
37
-
38
-
39
-
40
-
41
-
42
-
43
-
44
-
45
-
46
-
47
-
48
-
49
-
50
-
 51
51 -
 52
52 -
 53
53 -
 54
54 -
 55
55 -
 56
56 -
 57
57 -
 58
58 -
 59
59 -
 60
60 -
 61
61 -
 62
62 -
 63
63 -
 64
64 -
 65
65 -
 66
66 -
 67
67 -
 68
68 -
 69
69 -
 70
70 -
 71
71
 |
 |

64
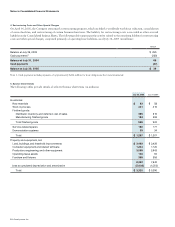
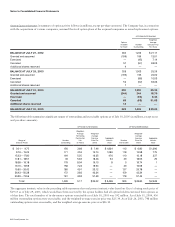
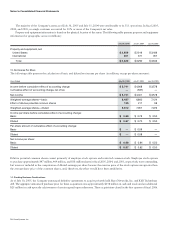
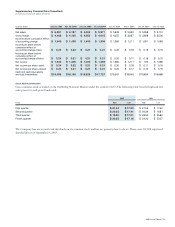
General Option Information A summary of option activity follows (in millions, except per-share amounts). The Company has, in connection
with the acquisitions of various companies, assumed the stock option plans of the acquired companies or issued replacement options.
BALANCE AT JULY 27, 2002
BALANCE AT JULY 26, 2003
BALANCE AT JULY 31, 2004 390 1,350 25.34
Granted and assumed (244) 244 18.70
Exercised — (93) 8.44
Canceled 63 (65) 31.63
Additional shares reserved 14 — —
BALANCE AT JULY 30, 2005 223 1,436 $ 25.02
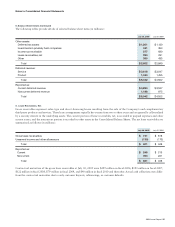
The following table summarizes significant ranges of outstanding and exercisable options as of July 30, 2005 (in millions, except years
and per-share amounts):
The aggregate intrinsic value in the preceding table represents the total pretax intrinsic value based on Cisco’s closing stock price of
$19.15 as of July 29, 2005, which would have been received by the option holders had all option holders exercised their options as
of that date. The total number of in-the-money options exercisable as of July 30, 2005 was 392 million. As of July 31, 2004, 436
million outstanding options were exercisable, and the weighted-average exercise price was $25.34. As of July 26, 2003, 748 million
outstanding options were exercisable, and the weighted-average exercise price was $26.12.
Notes to Consolidated Financial Statements