Cisco 2005 Annual Report Download - page 66
Download and view the complete annual report
Please find page 66 of the 2005 Cisco annual report below. You can navigate through the pages in the report by either clicking on the pages listed below, or by using the keyword search tool below to find specific information within the annual report.-
 1
1 -
2
-
3
-
4
-
5
-
6
-
7
-
8
-
9
-
10
-
11
-
12
-
13
-
14
-
15
-
16
-
17
-
18
-
19
-
20
-
21
-
22
-
23
-
24
-
25
-
26
-
27
-
28
-
29
-
30
-
31
-
32
-
33
-
34
-
35
-
36
-
37
-
38
-
39
-
40
-
41
-
42
-
43
-
44
-
45
-
46
-
47
-
48
-
49
-
50
-
51
-
52
-
53
-
54
-
55
-
 56
56 -
 57
57 -
 58
58 -
 59
59 -
 60
60 -
 61
61 -
 62
62 -
 63
63 -
 64
64 -
 65
65 -
 66
66 -
 67
67 -
 68
68 -
 69
69 -
 70
70 -
 71
71
 |
 |

69
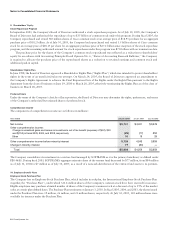
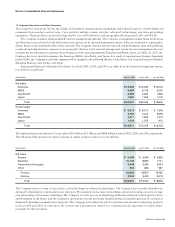
12. Segment Information and Major Customers
The Company’s operations involve the design, development, manufacturing, marketing, and technical support of networking and
communications products and services. Cisco products include routers, switches, advanced technologies, and other networking
equipment. These products, primarily integrated by Cisco IOS Software, link geographically dispersed LANs and WANs.
The Company conducts business globally and is managed geographically. The Company’s management makes financial decisions
and allocates resources based on the information it receives from its internal management system. Sales are attributed to a geographic
theater based on the ordering location of the customer. The Company does not allocate research and development, sales and marketing,
or general and administrative expenses to its geographic theaters in this internal management system because management does not
currently use the information to measure the performance of the operating segments. Based on established criteria, as of July 30, 2005, the
Company has four reportable segments: the Americas; EMEA; Asia Pacific; and Japan. As a result of organizational changes, beginning
in fiscal 2006, the Company’s reportable segments will be changed to the following theaters: United States and Canada; European Markets;
Emerging Markets; Asia Pacific; and Japan.
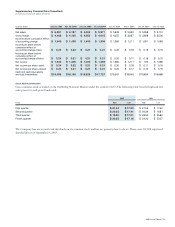
Summarized financial information by theater for fiscal 2005, 2004, and 2003, as taken from the internal management system,
is as follows (in millions):
July 30, 2005
$ 13,929
6,866
2,486
1,520
$ 24,801
$ 9,213
4,754
1,671
1,033
$ 16,671
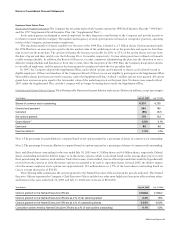
The Americas theater included non-U.S. net sales of $1.2 billion, $1.1 billion, and $888 million for fiscal 2005, 2004, and 2003, respectively.
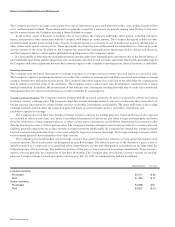
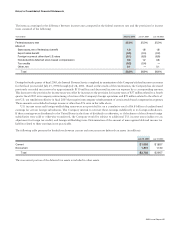
The following table presents net sales for groups of similar products and services (in millions):
July 30, 2005
$ 5,498
10,104
4,408
843
20,853
3,948
$ 24,801
The Company refers to some of its products and technologies as advanced technologies. The Company has currently identified six
advanced technologies for particular focus: enterprise IP communications, home networking, optical networking, security, storage
area networking, and wireless technology. The Company is in the process of identifying additional advanced technologies for focus
and investment in the future, and the Company’s investments in some previously identified advanced technologies may be curtailed or
eliminated depending on market developments. The Company reclassified net sales for switches and advanced technology products
in fiscal 2004 and 2003 to conform to the current year’s presentation related to a refinement in the reporting of certain rebate
programs for these products.
Notes to Consolidated Financial Statements