Cisco 2005 Annual Report Download - page 52
Download and view the complete annual report
Please find page 52 of the 2005 Cisco annual report below. You can navigate through the pages in the report by either clicking on the pages listed below, or by using the keyword search tool below to find specific information within the annual report.-
 1
1 -
2
-
3
-
4
-
5
-
6
-
7
-
8
-
9
-
10
-
11
-
12
-
13
-
14
-
15
-
16
-
17
-
18
-
19
-
20
-
21
-
22
-
23
-
24
-
25
-
26
-
27
-
28
-
29
-
30
-
31
-
32
-
33
-
34
-
35
-
36
-
37
-
38
-
39
-
40
-
41
-
 42
42 -
 43
43 -
 44
44 -
 45
45 -
 46
46 -
 47
47 -
 48
48 -
 49
49 -
 50
50 -
 51
51 -
 52
52 -
 53
53 -
 54
54 -
 55
55 -
 56
56 -
 57
57 -
 58
58 -
 59
59 -
 60
60 -
 61
61 -
 62
62 -
63
-
64
-
65
-
66
-
67
-
68
-
69
-
70
-
71
 |
 |
55
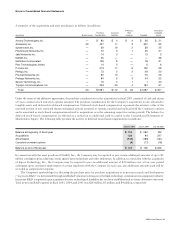
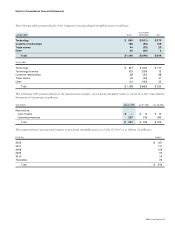
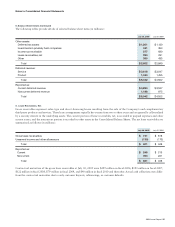
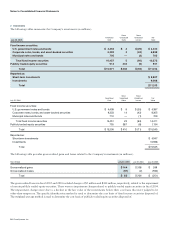
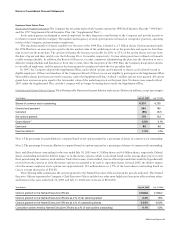
5. Balance Sheet Details (Continued)
The following tables provide details of selected balance sheet items (in millions):
July 30, 2005
$ 1,201
421
277
353
350
$ 2,602
$ 3,618
1,424
$ 5,042
$ 3,854
1,188
$ 5,042
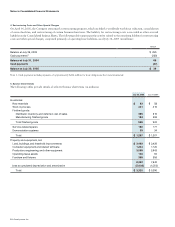
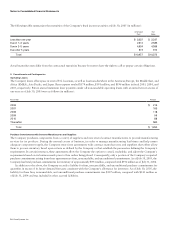
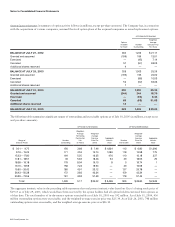
6. Lease Receivables, Net
Lease receivables represent sales-type and direct-financing leases resulting from the sale of the Company’s and complementary
third-party products and services. These lease arrangements typically have terms from two to three years and are generally collateralized
by a security interest in the underlying assets. The current portion of lease receivables, net, is recorded in prepaid expenses and other
current assets, and the noncurrent portion is recorded in other assets in the Consolidated Balance Sheets. The net lease receivables are
summarized as follows (in millions):
July 30, 2005
$ 731
(130)
$ 601
$ 248
353
$ 601
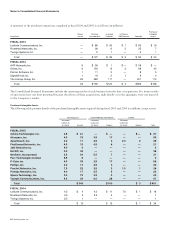
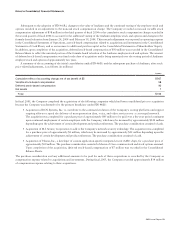
Contractual maturities of the gross lease receivables at July 30, 2005 were $299 million in fiscal 2006, $191 million in fiscal 2007,
$122 million in fiscal 2008, $79 million in fiscal 2009, and $40 million in fiscal 2010 and thereafter. Actual cash collections may differ
from the contractual maturities due to early customer buyouts, refinancings, or customer defaults.
Notes to Consolidated Financial Statements