Cisco 2005 Annual Report Download - page 22
Download and view the complete annual report
Please find page 22 of the 2005 Cisco annual report below. You can navigate through the pages in the report by either clicking on the pages listed below, or by using the keyword search tool below to find specific information within the annual report.-
 1
1 -
2
-
3
-
4
-
5
-
6
-
7
-
8
-
9
-
10
-
11
-
 12
12 -
 13
13 -
 14
14 -
 15
15 -
 16
16 -
 17
17 -
 18
18 -
 19
19 -
 20
20 -
 21
21 -
 22
22 -
 23
23 -
 24
24 -
 25
25 -
 26
26 -
 27
27 -
 28
28 -
 29
29 -
 30
30 -
 31
31 -
 32
32 -
33
-
34
-
35
-
36
-
37
-
38
-
39
-
40
-
41
-
42
-
43
-
44
-
45
-
46
-
47
-
48
-
49
-
50
-
51
-
52
-
53
-
54
-
55
-
56
-
57
-
58
-
59
-
60
-
61
-
62
-
63
-
64
-
65
-
66
-
67
-
68
-
69
-
70
-
71
 |
 |

25
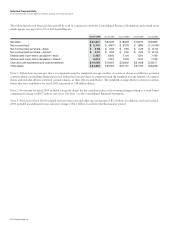
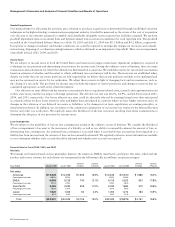
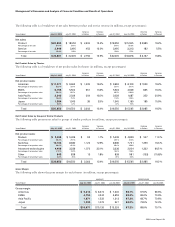
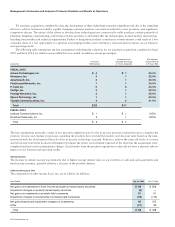
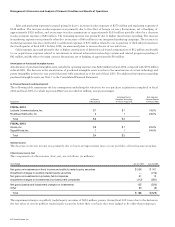
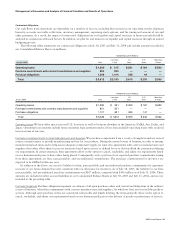
Net Product Sales by Theater
Net product sales in the Americas theater consist of net product sales in the United States and Americas International, which includes
Canada, Mexico, and Latin America. The increase in net product sales in the Americas theater was due to an increase in net product
sales to all of our customer markets in the United States. However, our sales to the U.S. federal government, included within our
enterprise market, experienced weakness due to, we believe, a realignment of spending priorities.
Net product sales in the EMEA theater increased primarily as a result of continued product deployment by service providers and
growth in enterprise markets. Net product sales in the United Kingdom represented the largest increase in the EMEA theater. In Asia
Pacific, net product sales increased primarily as a result of infrastructure builds, broadband acceleration, and investments by Asian
telecommunications carriers. The growth was primarily in the service provider and enterprise markets in India, Korea, and Australia.
However, we experienced weakness in our product sales to China. Net product sales in the Japan theater have continued to reflect
ongoing economic and other challenges in the theater.
As a result of organizational changes, beginning in fiscal 2006, our reportable segments will be changed to the following theaters:
United States and Canada; European Markets; Emerging Markets; Asia Pacific; and Japan. The organizational changes are designed to
align our focus on long-term growth, capture emerging market opportunities, and serve our customers better.
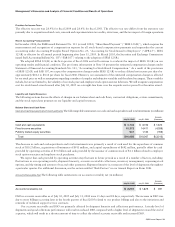
Net Product Sales by Groups of Similar Products
Routers The increase in net product sales related to routers in fiscal 2005 was primarily due to sales of high-end routers. Our sales
of high-end routers, which represent a larger proportion of our total router sales compared with midrange and low-end routers,
increased by $122 million over the prior fiscal year. Sales of our midrange and low-end routers decreased by $30 million. In fiscal
2005, we introduced the integrated services router. Sales of integrated services routers represented approximately 20% of our total
revenue from midrange and low-end routers in fiscal 2005. For the fourth quarter of fiscal 2005, sales of integrated services routers
represented approximately 35% of our total revenue from midrange and low-end routers. Our high-end router sales are primarily
to service providers, which tend to make large and sporadic purchases. In addition, our router sales in fiscal 2005 may have been
impacted by new product introductions and increased competition from price-focused competitors.
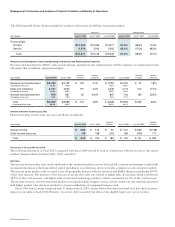
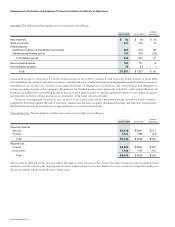
Switches The increase in net product sales related to switches in fiscal 2005 was due to sales of local-area network (LAN) fixed
switches and LAN modular switches. Our sales of LAN fixed and modular switches increased by approximately $1.2 billion,
compared with last fiscal year. The increase in sales of LAN switches was a result of the continued adoption of new technologies by
our customers, resulting in higher sales of our high-end modular switch, the Cisco Catalyst 6500 Series, and fixed switches, including
the Cisco Catalyst 3750 Series and Catalyst 3560 Series.
Advanced Technologies We experienced higher sales in fiscal 2005 in all of our advanced technologies compared with fiscal 2004.
Home networking product sales increased by approximately $250 million, and were related to the growth of our wireless and wired
router businesses. Enterprise IP communications sales increased by approximately $220 million primarily due to sales of IP phones
and associated software as our customers transitioned from an analog-based to an IP-based infrastructure. Sales of security products
increased by approximately $210 million primarily due to module and line-card sales related to our routers and LAN modular
switches as customers continued to emphasize network security. Optical product sales increased by approximately $150 million due
to sales of the Cisco ONS 15454E and ONS 15454 platforms. Wireless LAN product sales increased by approximately $135 million.
Sales of storage area networking products increased by approximately $105 million. Wireless LAN and storage area networking
product sales increased primarily due to new customers and continued deployments with existing customers.
Management’s Discussion and Analysis of Financial Condition and Results of Operations