Cisco 2005 Annual Report Download - page 53
Download and view the complete annual report
Please find page 53 of the 2005 Cisco annual report below. You can navigate through the pages in the report by either clicking on the pages listed below, or by using the keyword search tool below to find specific information within the annual report.-
 1
1 -
2
-
3
-
4
-
5
-
6
-
7
-
8
-
9
-
10
-
11
-
12
-
13
-
14
-
15
-
16
-
17
-
18
-
19
-
20
-
21
-
22
-
23
-
24
-
25
-
26
-
27
-
28
-
29
-
30
-
31
-
32
-
33
-
34
-
35
-
36
-
37
-
38
-
39
-
40
-
41
-
42
-
 43
43 -
 44
44 -
 45
45 -
 46
46 -
 47
47 -
 48
48 -
 49
49 -
 50
50 -
 51
51 -
 52
52 -
 53
53 -
 54
54 -
 55
55 -
 56
56 -
 57
57 -
 58
58 -
 59
59 -
 60
60 -
 61
61 -
 62
62 -
 63
63 -
64
-
65
-
66
-
67
-
68
-
69
-
70
-
71
 |
 |

56
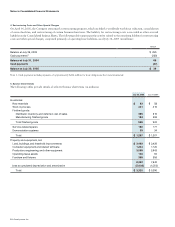
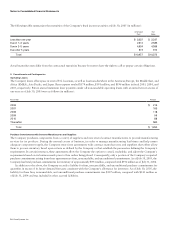
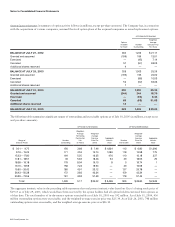
7. Investments
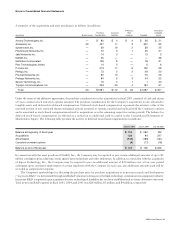
The following tables summarize the Company’s investments (in millions):
July 30, 2005
Fixed income securities:
U.S. government notes and bonds $ 3,453 $ 2 $ (25) $ 3,430
Corporate notes, bonds, and asset-backed securities 6,299 3 (63) 6,239
Municipal notes and bonds 705 — (2) 703
Total fixed income securities 10,457 5 (90) 10,372
Publicly traded equity securities 514 433 (6) 941
Total $ 10,971 $ 438 $ (96) $ 11,313
Reported as:
Short-term investments $ 2,227
Investments 9,086
Total $ 11,313
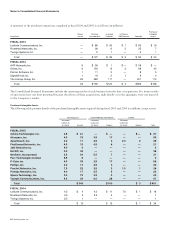
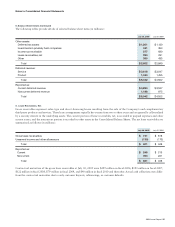
The following table provides gross realized gains and losses related to the Company’s investments (in millions):
July 30, 2005
$ 144
(61)
$ 83
The gross realized losses in fiscal 2005 and 2003 included charges of $5 million and $412 million, respectively, related to the impairment
of certain publicly traded equity securities. There were no impairment charges related to publicly traded equity securities in fiscal 2004.
The impairment charges were due to a decline in the fair value of the investments below their cost basis that were judged to be
other-than-temporary. The specific identification method is used to determine the cost basis of fixed income securities disposed of.
The weighted-average method is used to determine the cost basis of publicly traded equity securities disposed of.
Notes to Consolidated Financial Statements