Cisco 2005 Annual Report Download - page 16
Download and view the complete annual report
Please find page 16 of the 2005 Cisco annual report below. You can navigate through the pages in the report by either clicking on the pages listed below, or by using the keyword search tool below to find specific information within the annual report.-
 1
1 -
2
-
3
-
4
-
5
-
 6
6 -
 7
7 -
 8
8 -
 9
9 -
 10
10 -
 11
11 -
 12
12 -
 13
13 -
 14
14 -
 15
15 -
 16
16 -
 17
17 -
 18
18 -
 19
19 -
 20
20 -
 21
21 -
 22
22 -
 23
23 -
 24
24 -
 25
25 -
 26
26 -
27
-
28
-
29
-
30
-
31
-
32
-
33
-
34
-
35
-
36
-
37
-
38
-
39
-
40
-
41
-
42
-
43
-
44
-
45
-
46
-
47
-
48
-
49
-
50
-
51
-
52
-
53
-
54
-
55
-
56
-
57
-
58
-
59
-
60
-
61
-
62
-
63
-
64
-
65
-
66
-
67
-
68
-
69
-
70
-
71
 |
 |
19
Forward-Looking Statements
This Management’s Discussion and Analysis of Financial Condition and Results of Operations contains forward-looking statements
regarding future events and our future results that are subject to the safe harbors created under the Securities Act of 1933
(the “Securities Act”) and the Securities Exchange Act of 1934 (the “Exchange Act”). These statements are based on current
expectations, estimates, forecasts, and projections about the industries in which we operate and the beliefs and assumptions of our
management. Words such as “expects,” “anticipates,” “targets,” “goals,” “projects,” “intends,” “plans,” “believes,” “seeks,”
“estimates,” “continues,” “may,” variations of such words, and similar expressions are intended to identify such forward-looking
statements. In addition, any statements that refer to projections of our future financial performance, our anticipated growth and
trends in our businesses, and other characterizations of future events or circumstances are forward-looking statements. Readers are cautioned
that these forward-looking statements are only predictions and are subject to risks, uncertainties, and assumptions that are difficult to predict,
including those identified below, as well as on the inside back cover of this Annual Report to Shareholders and under “Risk Factors,” and
elsewhere in our Annual Report on Form 10-K. Therefore, actual results may differ materially and adversely from those expressed in any
forward-looking statements. We undertake no obligation to revise or update any forward-looking statements for any reason.
Overview
We sell scalable, standards-based networking products that address a wide range of customers’ business needs, including improving
productivity, reducing costs, and gaining a competitive advantage. Our corresponding technology focus is on delivering networking
products and systems that simplify customers’ infrastructures, offer integrated services, and are highly secure. Our products and
services help customers build their own network infrastructures that support tools and applications that allow them to communicate
with key stakeholders, including customers, prospects, business partners, suppliers, and employees. Our product offerings fall into
several categories: our core technologies, routing and switching; advanced technologies (currently including enterprise Internet
Protocol (IP) communications, home networking, optical networking, security, storage area networking, and wireless technology);
and other products, including our access products and network management software. In addition to our product offerings, we
provide a broad range of service offerings, including technical support services and advanced services. Our customer base spans
virtually all types of public and private agencies and businesses, comprising large enterprise companies, service providers, and
commercial customers. We also have consumer customers through our Linksys division.
In fiscal 2005, we focused on three long-term financial priorities:
• Seek profitable growth opportunities
• Achieve profitability targets and improve productivity
• Increase shareholder value
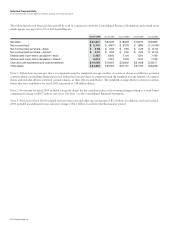
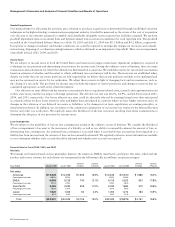
Our results for fiscal 2005 reflected increases in net sales, net income, and net income per share from fiscal 2004. Net sales
were $24.8 billion, compared with $22.0 billion in fiscal 2004. Net income was $5.7 billion, compared with $4.4 billion in fiscal
2004. Diluted earnings per share were $0.87, compared with $0.62 in fiscal 2004. We have continued to achieve a good balance in
revenue growth from our geographic segments, customer markets, and product families, as reflected by different geographic segments,
customer markets, and product families experiencing the highest comparative quarterly revenue growth on a percentage basis over
the course of fiscal 2005 and fiscal 2004.
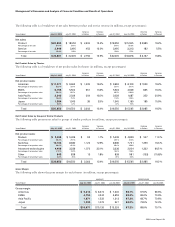
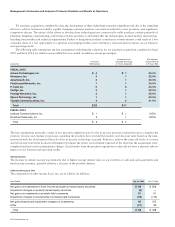
Revenue increased in each of our geographic segments, with the Americas and Europe, Middle East, and Africa (EMEA) theaters
together contributing 88.4% of the total increase in fiscal 2005. In addition, during fiscal 2005, sales of our switches, which represent
the largest component of our product revenue, increased 12.5%. We also experienced increased sales of our advanced technologies
products of 32.1%, reflecting an increase in sales of each of our six advanced technologies product categories. Our router revenue
increased by 1.7%. Our gross margins declined from last fiscal year. Product gross margin declined primarily due to higher sales of
certain lower-margin products related to switching and home networking and to the effects of pricing and discounts, which were
partially offset by higher shipment volumes and lower manufacturing and other costs. We have continued to encounter price-focused
competition, including competitors from Asia and, in particular, China. Service gross margin declined as we continued to invest in
advanced services and technical support services. Operating expenses as a percentage of net sales have continued to decline year over year.
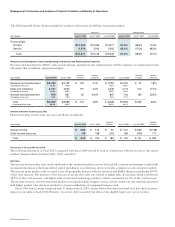
Cash flows from operations were $7.6 billion, compared with $7.0 billion for fiscal 2004. With regard to our balance sheet,
at the end of fiscal 2005, cash and cash equivalents and total investments were $16.1 billion and for the fourth quarter of fiscal
2005, days sales outstanding (DSO) were 31 days and annualized inventory turns were 6.6. During the fiscal year, we repurchased
$10.2 billion or 540 million shares of our common stock at an average price of $18.95. At the end of fiscal 2005, our cumulative
purchases since the inception of the share repurchase program in September 2001 were approximately $27.2 billion,
or 1.5 billion shares, at an average price of $18.15.
Management’s Discussion and Analysis of Financial Condition and Results of Operations