Cisco 2005 Annual Report Download - page 34
Download and view the complete annual report
Please find page 34 of the 2005 Cisco annual report below. You can navigate through the pages in the report by either clicking on the pages listed below, or by using the keyword search tool below to find specific information within the annual report.-
 1
1 -
2
-
3
-
4
-
5
-
6
-
7
-
8
-
9
-
10
-
11
-
12
-
13
-
14
-
15
-
16
-
17
-
18
-
19
-
20
-
21
-
22
-
23
-
 24
24 -
 25
25 -
 26
26 -
 27
27 -
 28
28 -
 29
29 -
 30
30 -
 31
31 -
 32
32 -
 33
33 -
 34
34 -
 35
35 -
 36
36 -
 37
37 -
 38
38 -
 39
39 -
 40
40 -
 41
41 -
 42
42 -
 43
43 -
 44
44 -
45
-
46
-
47
-
48
-
49
-
50
-
51
-
52
-
53
-
54
-
55
-
56
-
57
-
58
-
59
-
60
-
61
-
62
-
63
-
64
-
65
-
66
-
67
-
68
-
69
-
70
-
71
 |
 |

37
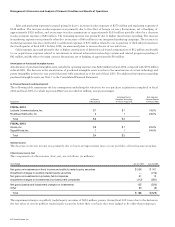
Investments
We maintain an investment portfolio of various holdings, types, and maturities. See Note 7 to the Consolidated Financial Statements.
These securities are generally classified as available-for-sale and consequently are recorded in the Consolidated Balance Sheets
at fair value with unrealized gains or losses, to the extent unhedged, reported as a separate component of accumulated other
comprehensive income, net of tax.
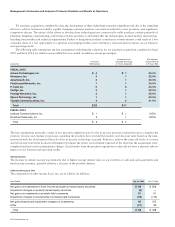
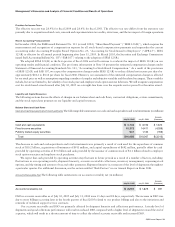
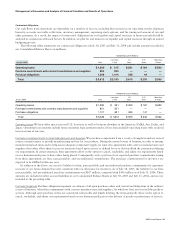
Fixed Income Securities
At any time, a sharp rise in interest rates could have a material adverse effect on the fair value of our investment portfolio. Conversely,
declines in interest rates could have a material effect on interest income for our investment portfolio. Our investments are not
leveraged as of July 30, 2005, and are held for purposes other than trading. The modeling technique used measures the change in
fair value arising from selected potential changes in interest rates. Market changes reflect immediate hypothetical parallel shifts in the
yield curve of plus or minus 50 basis points (“BPS”), 100 BPS, and 150 BPS. The following tables present the hypothetical changes in
fair value in investment securities held at July 30, 2005 and July 31, 2004 that are sensitive to changes in interest rates (in millions):
FAIR VALUE
AS OF
JULY 30,
2005
$ 3,430
6,942
$ 10,372
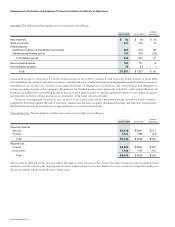
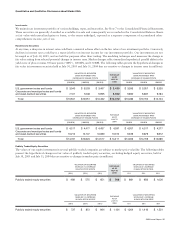
Publicly Traded Equity Securities
The values of our equity investments in several publicly traded companies are subject to market price volatility. The following tables
present the hypothetical changes in fair value of publicly traded equity securities, excluding hedged equity securities, held at
July 30, 2005 and July 31, 2004 that are sensitive to changes in market price (in millions):
FAIR VALUE
AS OF
JULY 30,
2005
$ 766
Quantitative and Qualitative Disclosures about Market Risk