Cisco 2005 Annual Report Download - page 24
Download and view the complete annual report
Please find page 24 of the 2005 Cisco annual report below. You can navigate through the pages in the report by either clicking on the pages listed below, or by using the keyword search tool below to find specific information within the annual report.-
 1
1 -
2
-
3
-
4
-
5
-
6
-
7
-
8
-
9
-
10
-
11
-
12
-
13
-
 14
14 -
 15
15 -
 16
16 -
 17
17 -
 18
18 -
 19
19 -
 20
20 -
 21
21 -
 22
22 -
 23
23 -
 24
24 -
 25
25 -
 26
26 -
 27
27 -
 28
28 -
 29
29 -
 30
30 -
 31
31 -
 32
32 -
 33
33 -
 34
34 -
35
-
36
-
37
-
38
-
39
-
40
-
41
-
42
-
43
-
44
-
45
-
46
-
47
-
48
-
49
-
50
-
51
-
52
-
53
-
54
-
55
-
56
-
57
-
58
-
59
-
60
-
61
-
62
-
63
-
64
-
65
-
66
-
67
-
68
-
69
-
70
-
71
 |
 |
27
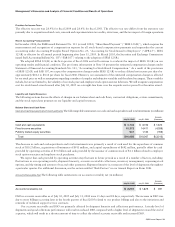
Service Gross Margin
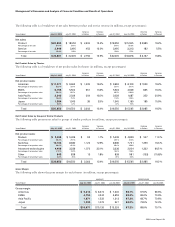
Service gross margin percentage decreased by 1.8%. The decrease in service gross margin was primarily due to increased investments
in the service portion of our business during fiscal 2005. One specific area of investment is advanced services, comprising highly
specialized employees. As we add personnel and resources to support growth in this business, our service margins will typically be
adversely affected in the near term. We have also added investments in our technical support business.
Our service gross margin from technical support services is higher than service gross margin from our advanced services. Service
gross margin will typically experience some variability over time due to various factors such as the change in mix between technical
support services and advanced services, as well as the timing of technical support service contract initiations and renewals and the
timing of our adding personnel and resources to support this business. Our revenue from advanced services may continue to increase
to a higher proportion of total service revenue due to our continued focus on providing comprehensive support to our customers’
networking devices, applications, and infrastructures.
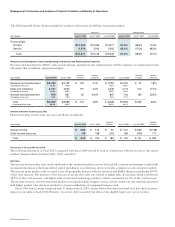
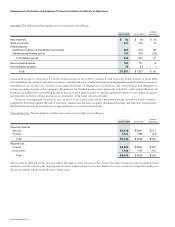
Research and Development, Sales and Marketing, and General and Administrative Expenses
R&D expenses in fiscal 2005 were higher primarily due to higher headcount-related expenses of approximately $75 million and higher
discretionary spending of approximately $35 million. We have continued to invest in R&D activities and to purchase or license
technology in order to bring a broad range of products to market in a timely fashion. If we believe that we are unable to enter a
particular market in a timely manner with internally developed products, we may license technology from other businesses or acquire
businesses as an alternative to internal R&D. All of our R&D costs have been expensed as incurred.
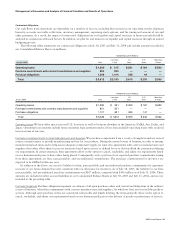
Sales and marketing expenses in fiscal 2005 increased due to higher sales expenses of $151 million and higher marketing
expenses of $40 million. Sales expenses increased primarily due to the effect of foreign currency fluctuations of approximately $100
million, net of hedging; and an increase in headcount-related expenses of approximately $60 million (including an adjustment of
approximately $40 million relating to the prior fiscal year which reduced sales commissions). Marketing expenses increased primarily
due to various marketing programs globally and other marketing investments.
The increase in our general and administrative expenses in fiscal 2005 was primarily attributable to costs incurred associated with
various compliance programs and expenses related to investments in internal information technology systems and related program spending.
We continued to increase our headcount in fiscal 2005. Our headcount increased by 4,042 employees in fiscal 2005, of which
approximately 1,200 of the new employees were attributable to acquisitions we completed in fiscal 2005. We intend to continue to
add both engineering and sales resources as we focus on developing the next wave of advanced technologies, growing the commercial
market segment, capitalizing on our emerging market opportunities, and increasing our market share gains. If we do not achieve the
benefits anticipated from these investments, our operating results may be adversely affected.
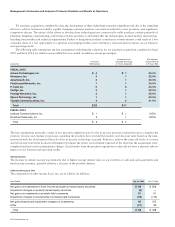
Amortization of Purchased Intangible Assets
Amortization of purchased intangible assets included in operating expenses was $227 million in fiscal 2005, compared with $242
million in fiscal 2004. For additional information regarding purchased intangibles, see Note 3 to the Consolidated Financial Statements.
In-Process Research and Development
Our methodology for allocating the purchase price, relating to purchase acquisitions, to in-process R&D is determined through
established valuation techniques in the high-technology communications equipment industry. In-process R&D expense in fiscal
2005 was $26 million, compared with $3 million in fiscal 2004. See Note 3 to the Consolidated Financial Statements for additional
information regarding the acquisitions completed in fiscal 2005 and fiscal 2004 and the in-process R&D recorded for each
acquisition. In-process R&D was expensed upon acquisition because technological feasibility had not been established and no future
alternative uses existed.
The fair value of the existing purchased technology and patents, as well as the technology under development, is determined
using the income approach, which discounts expected future cash flows to present value. The discount rates used in the present value
calculations are typically derived from a weighted-average cost of capital analysis and venture capital surveys, adjusted upward to
reflect additional risks inherent in the development lifecycle. We consider the pricing model for products related to these acquisitions
to be standard within the high-technology communications equipment industry. However, we do not expect to achieve a material
amount of expense reductions as a result of integrating the acquired in-process technology. Therefore, the valuation assumptions do
not include significant anticipated cost savings.
Management’s Discussion and Analysis of Financial Condition and Results of Operations